

America is running out of houses
What it means
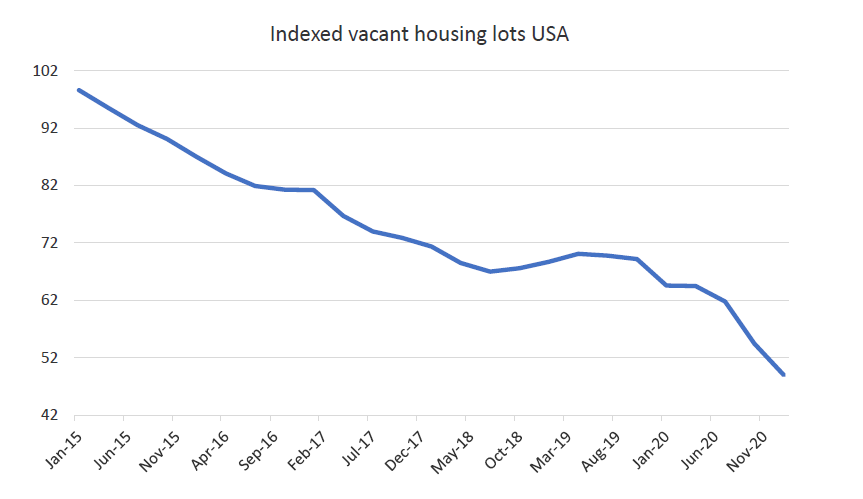
House prices around the world are rising rapidly – including in the United States.
Recent gains have re-opened old GFC wounds, with escalating concern of another housing bubble.
However, the data suggests the gains are driven not so much by excessive demand, but lack of supply. The number of ready to build lots is down ~50% over the past 5 years. And while some of this can be blamed on the disruption from COVID, the trend was well established prior to 2020. The issue, it seems, is the gutting of the housing industry in 2009-2010 and the subsequent lack of skilled labour available to supply new lots and houses for the new cycle.
In short, it appears recent house price gains in the US are more structural than cyclical.
The Aussie consumer is back – big time
Source: ABS, Quay Global Investors
What it meansSource:
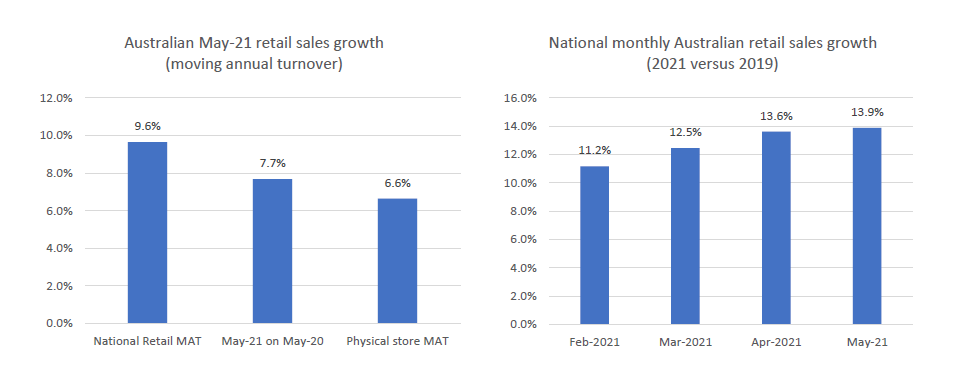
Sometimes when looking at the detail we miss the bigger picture. How often do we hear ‘retail sales beat / missed expectations’, and then simply move onto the next economic data point? But looking at the total data, there is no doubt – retail sales are booming in Australia.
The chart on the left tells a few stories. It shows retail sales growth on a ‘moving annual turnover’ (MAT) basis – in the same way a shopping centre owner would view it. On a national scale the numbers are clearly very good (+9.6% growth), and even after stripping out e-commerce sales, physical store MAT growth is strong (+6.6%) – during a pandemic!
But what about the so-called base effect? Well, the chart on the right shows that when comparing monthly retail sales to 2019, there can be no doubt – the Aussie consumer is back.
But it’s all happening online … right?
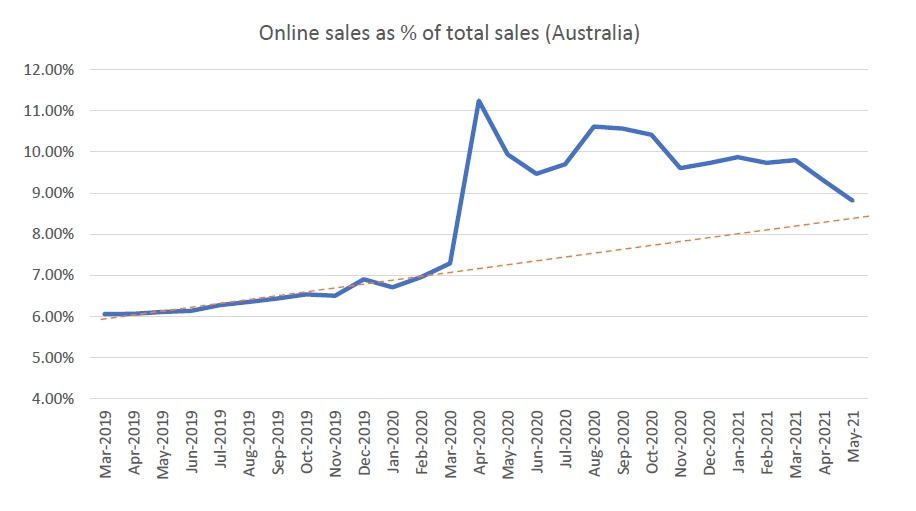
The pandemic did not permanently change our shopping behaviour
Source: ABS, Quay Global Investors
What it means
In the heat of the moment, it is always tempting to extrapolate the current environment into perpetuity. However, mean-reversion is a hell of a thing.
Last year the narrative “the pandemic has accelerated existing trends” was popular. In reality, we are simply returning to the pre-pandemic environment. This has two really important implications for real estate.
- The physical retail property story has not changed for the worse as a result of the pandemic. In fact, coupled with recent retail sales data (see previous chart), the fundamentals for physical retail have improved.
- Many businesses aggressively expanded warehouse demand to cater for booming online sales during the pandemic. We believe there is some risk that industrial owners / developers are building excess supply at a time when consumer behaviour is normalising. The nightmare scenario for industrial owners is if lockdown-weary consumers return to physical retail in greater numbers and online sales fall below the pre-pandemic trend – just in time for record new supply.
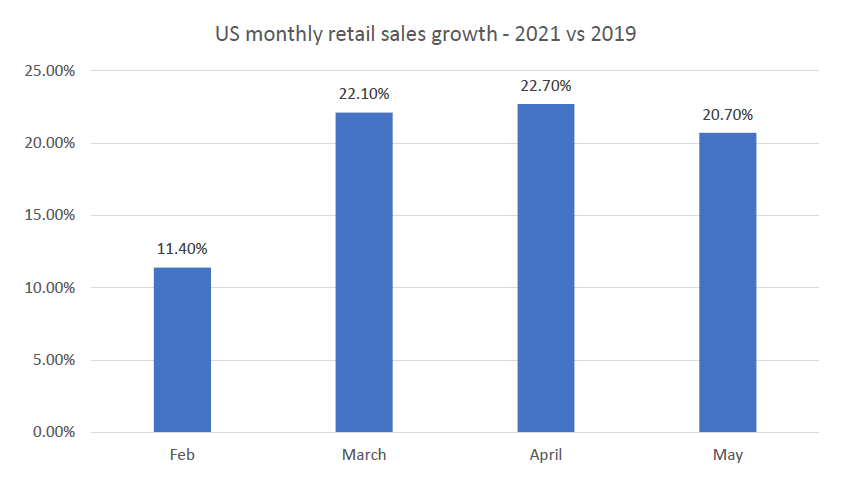
Retail is booming in the US too
Source: BEA, Quay Global Investors
What it means
Like Australia, US retail sales are booming compared to 2019 data. And like Australia, the spoils are being shared across e-commerce and physical retail.
What’s driving this?
The common story is the consumer has a lack of spending options under COVID (limited travel, dining, etc). As such, this boom won’t last.
However, we think there is more to this story – and it points to a solid (structural) change in household balance sheets.
Retail is booming, yet households are saving – how is this possible?
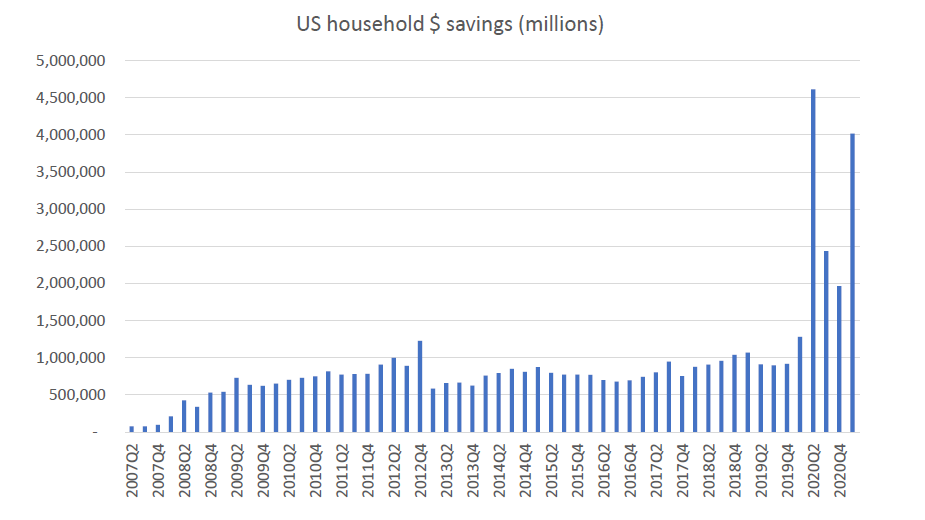
Source: BEA, St Louis Fed, Quay Global Investors
What it means
It seems like an oxymoron. How are retail sales booming at a time of a huge surge in household savings?
To understand this is to understand that the current consumer boom is far more sustainable than it may seem.
First, households are a major beneficiary from large government deficits – which is in fact the way governments proverbially ‘print money’ (i.e. it’s not quantitative easing). So, households can simultaneously spend and accrue savings via government transfers.
Yet even when the stimulus ends, this money does not go away. Federal deficits effectively spend money into existence. One person’s spending (government) is another’s income (non-government). Across the non-government sector, spent savings are simply transferred between private sector bank accounts.
So this pool of money is staying in private sector hands until it is taxed out of existence by the federal government. That won’t happen in aggregate until the US runs a budget surplus. And it doesn’t feel like that’s coming any time soon.
Said another way, we believe the recapitalisation of household balance sheets across the world is structural, and permanent.
The so called ‘re-opening trade’ is very uneven
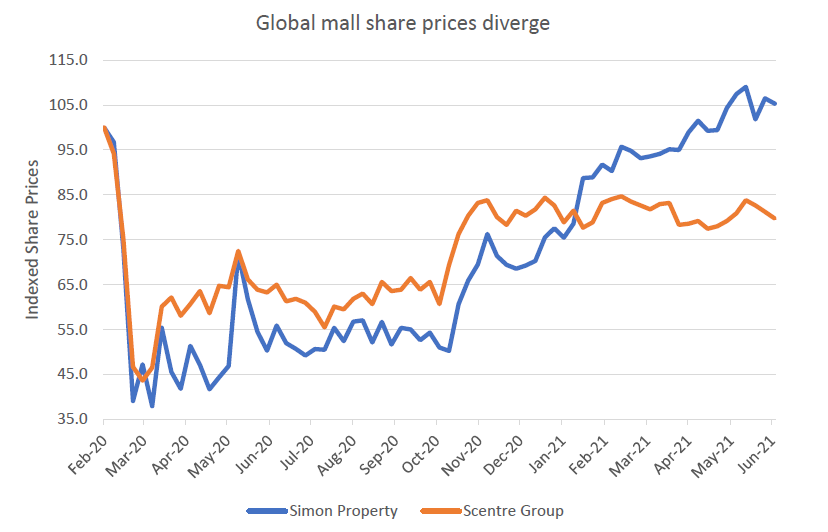
Source: Bloomberg, Quay Global Investors
What it means
Since the announcement of the successful vaccine trials late last year, many stocks and sectors have performed well, benefiting from the so called ‘re-opening trade’.
Of course, this makes sense. However, there appear to have been a few inconsistencies. How can hotel REITs now be back above pre-pandemic prices, yet office towers (where some of the same underlying assets are located on the same street) are still trading 10-15% below?
Even within the same sector, the largest retailer landlords (Simon Property, Scentre Group) are delivering very different performances despite similar macroeconomic stories (see earlier retail charts). Moreover, by most metrics, the local landlord (Scentre) appears to be delivering better sales, footfall and overall occupancies – but remains 20% below its pre-pandemic price. Meanwhile, Simon is trading comfortably above.
The lesson? The re-open trade makes sense, but pay attention to the underlying stock fundamentals – perhaps significant relative value is emerging?
At similar points in the cycle, rising interest rates are good for real estate and not great for equities
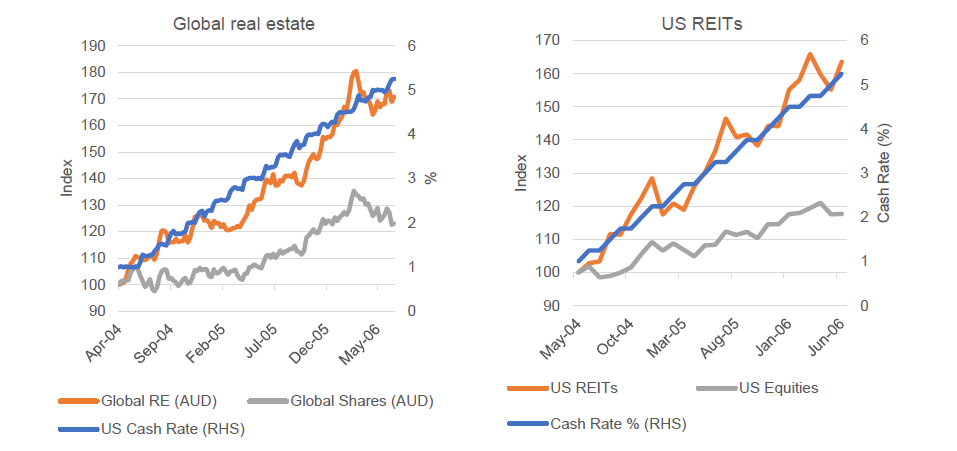
Bloomberg, Quay Global Investors
What it means
Rising interest rates are bad for listed real estate?
This is one of our favourite myths.
When the US (and the world) was recovering from the 2001-2002 recession, rising interest rates from 2004 corresponded with listed real estate significantly outperforming equities, both in the US and globally.
Why?
During the early stages of recovery, built real estate generally has excess capacity (which we call vacancy). Rising interest rates signal a strong economy, which means the vacancy is easily filled – resulting in strong earnings growth.
We acknowledge this cycle is very different. The key is to target sectors with elevated vacancy from the pandemic (office, retail, senior housing) and be wary of sectors already running at full capacity (industrial).
Here comes the taper … but who cares?
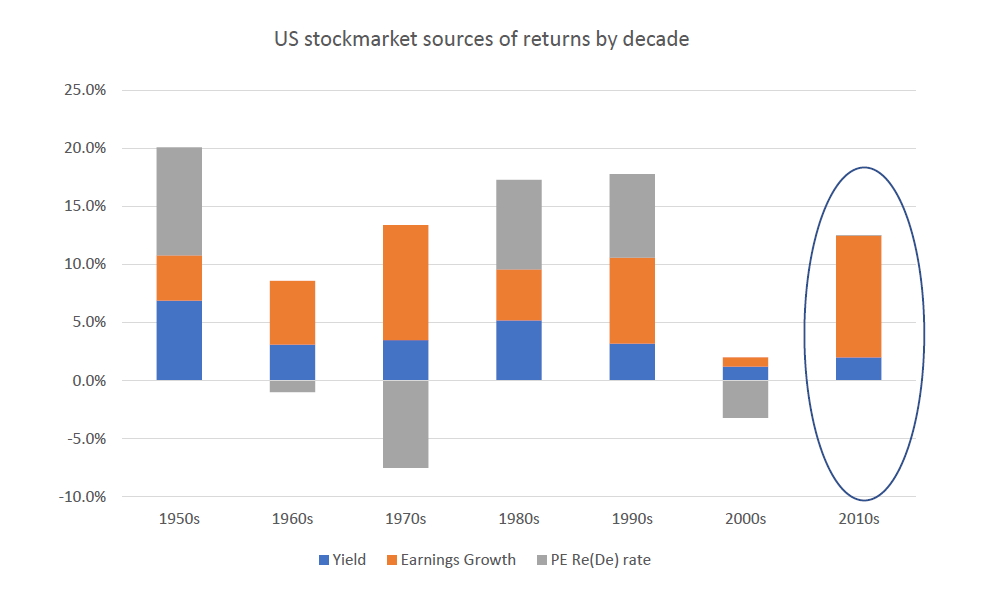
Source: Jack Bogle, Ben Carlson, Quay Global Investors
What it means
Okay, we admit we’ve published this a few times before. However, given the rapid economic recovery around the world, talk of a Federal reserve ‘taper’ (reducing of asset purchases) is causing some concern among the usual talking heads.
All too often we hear day-to-day share market returns are influenced by central bank action: ‘flooding the market with liquidity’ to drive up share prices. Of course, central bank liquidity does no such thing, because central bank liquidity is non-fungible with liquidity used by consumers, businesses or investors[1]. Central bank liquidity simply facilitates the settlement of interbank transfers for and on behalf of bank customers. How ‘the market’ ever convinced itself otherwise remains a mystery.
Don’t believe us? Well, in the decade that the US Federal Reserve was most active with asset purchases (2010s), nearly 100% of the total return could be explained by dividend yield and earnings growth. There was no P/E rerate benefit, despite the secular fall in interest rates over the decade.
This is an important observation in the current environment. Too often the Fed and low interest rates are blamed (or credited) for market performance, when the reality is that returns come from earnings growth and dividends. No matter what the Fed does, investors would be wise to spend more time thinking about company prospects rather than central bank actions.
[1] For more on this point, refer to our article Thinking about liquidity.
The content contained in this article represents the opinions of the authors. The authors may hold either long or short positions in securities of various companies discussed in the article. This commentary in no way constitutes a solicitation of business or investment advice. It is intended solely as an avenue for the authors to express their personal views on investing and for the entertainment of the reader.