


It appears inflation really was transitory
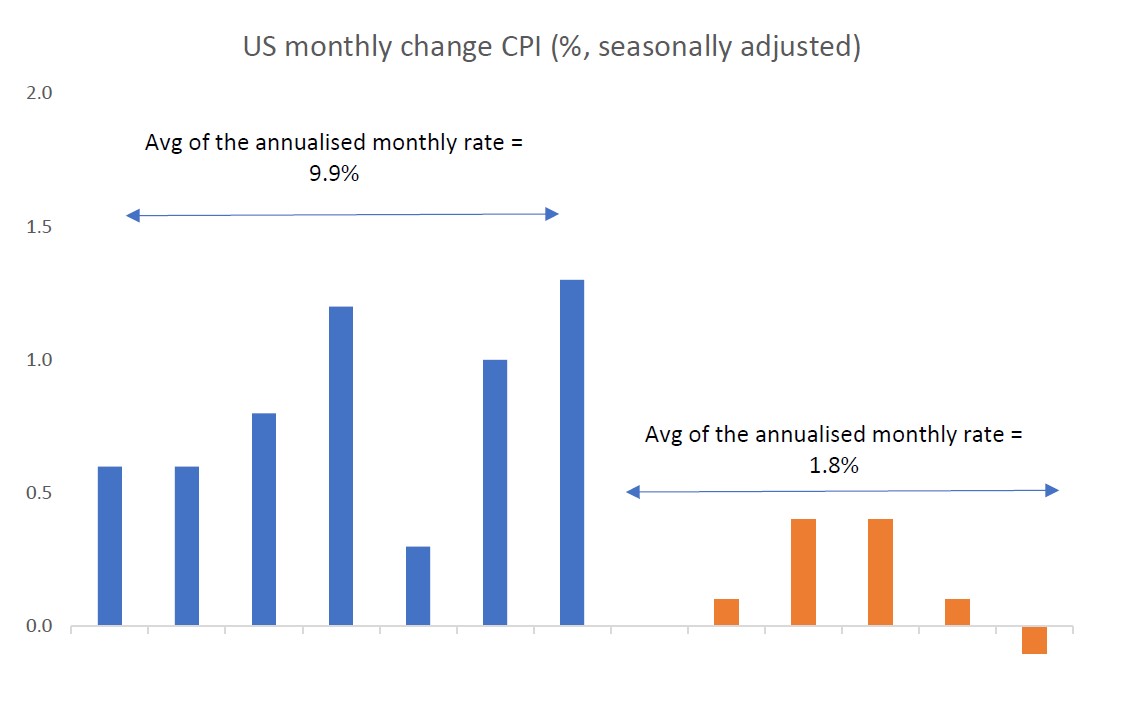
Source: BLS, Quay
What it means
One of the economic debates of the past year was whether inflation was transitory in nature as a result of short-term supply side constraints, or more entrenched and structural.
While the headline ‘annual inflation rate’ still appears elevated and well above the US Federal Reserve’s target of 2%, more recent data suggests the Fed’s goals have already been achieved. Based on the past six months of data in 2022, the annualised rate of inflation (headline) is just 1.8%
What’s most striking about the recent data is that it includes an annualised +6.2% increase in rent and shelter costs (accounting for ~30% of the CPI). However, rent growth is decelerating quickly[1], and is likely to slice a further 1% per year off the recent inflation prints, potentially pushing the US into deflation in the second half of 2023.
And the transitory story doesn’t apply only to the US
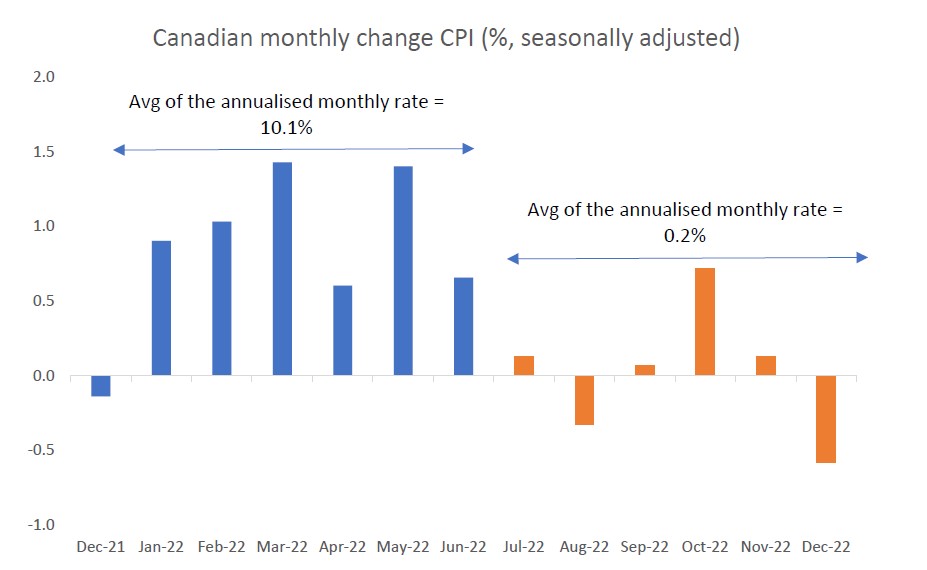
Source: Statistics Canada, Quay Global Investors
What it means
While Australia has recently introduced monthly CPI data, it’s still somewhat unreliable as to where “real time” inflation really sits. In fact, ABS monthly CPI data excludes around 30% of the data used in quarterly CPI statistics[2]
At Quay, we tend to believe Canada is structurally similar to Australia from an economic perspective -- we have a similarly dispersed and sized population, and an economy reliant on housing, resources and finance. The good news is the transitory evidence of inflation is also clear for the Canadian economy, which we think bodes well for Australia and other developed economies.
More evidence we don’t need a recession to tame inflation
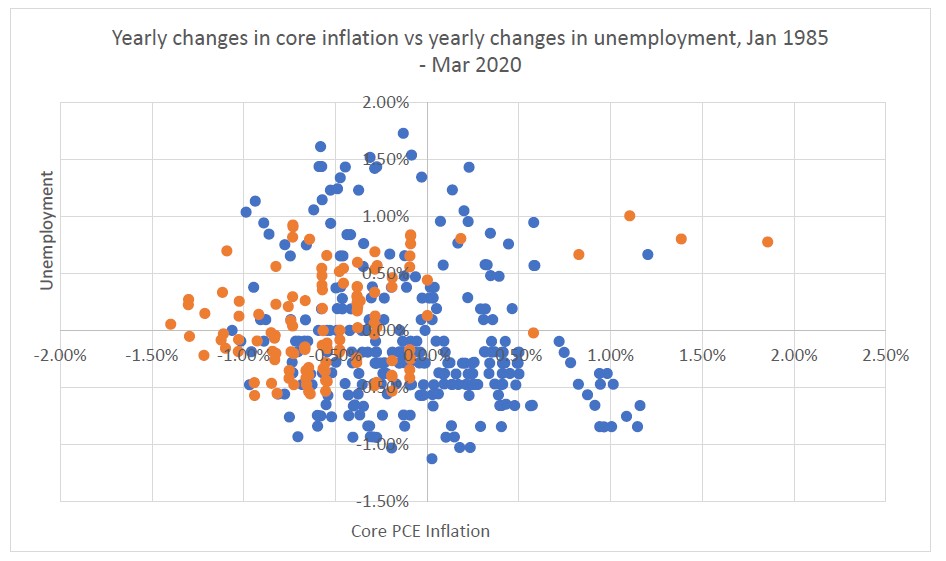
Source: Financial Times, St Louis Fred, Quay
What it means
The conventional wisdom with current interest rates policy is that in order to tame inflation, central banks must engineer a deacceleration in the economy. This, by definition, requires some weakness in the labour market (i.e. rising unemployment). For much of 2022, many investors questioned “from which poison chalice do we wish to drink – inflation or recession”?
The good news is the relationship between inflation and unemployment (commonly knowns as the ‘Phillips Curve’), is largely non-existent. The scatter plot above shows very little relationship in the change of one variable impacting the other. Note, the orange dots reflect the post GFC world (Jan 2010-March 2020), while the blue dots reflect pre GFC (Jan 1985-August 2008). We excluded the GFC period due to the fact the change in employment and inflation was not a specific policy initiative at the time. The R-squared of the above data is just 1.7% (i.e., meaningless).
Even after lagging the data for several periods, the highest R squared we could find was 16% (meaning change in employment only explains 16% in the change in inflation, with 84% caused by other factors).
This means inflation can fall without a major recession or increase in unemployment. So far, the data seems to be suggesting this will be the case.
Is monetary policy supporting growth?
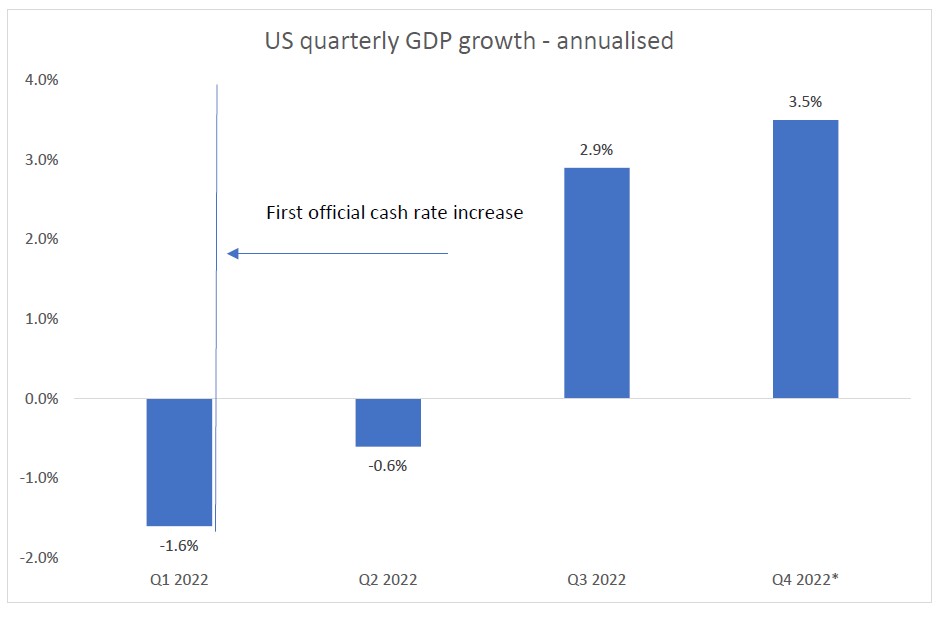
Source: St Louis Fred, Quay - * based on Atlanta Fed GDPNOW as at January 20, 202
What it means
Since the first US interest rate increase (March 2022), US GDP growth has accelerated.
This must be becoming a great source of embarrassment for central banks. Despite rising interest rates, real economic activity has remained robust. Notwithstanding the odd headline of job losses, the consumer and labour markets continue to be resilient.
So, is monetary policy actually doing what it is supposed to do?
Of course advocates will suggest this is just a lag and economic pain is just around the corner, but as Japanese central bankers will confirm (after 20 years of QE and no inflation), the lag argument eventually becomes ludicrous. Perhaps something else is going on?
We think part of the answer lies with the next chart.
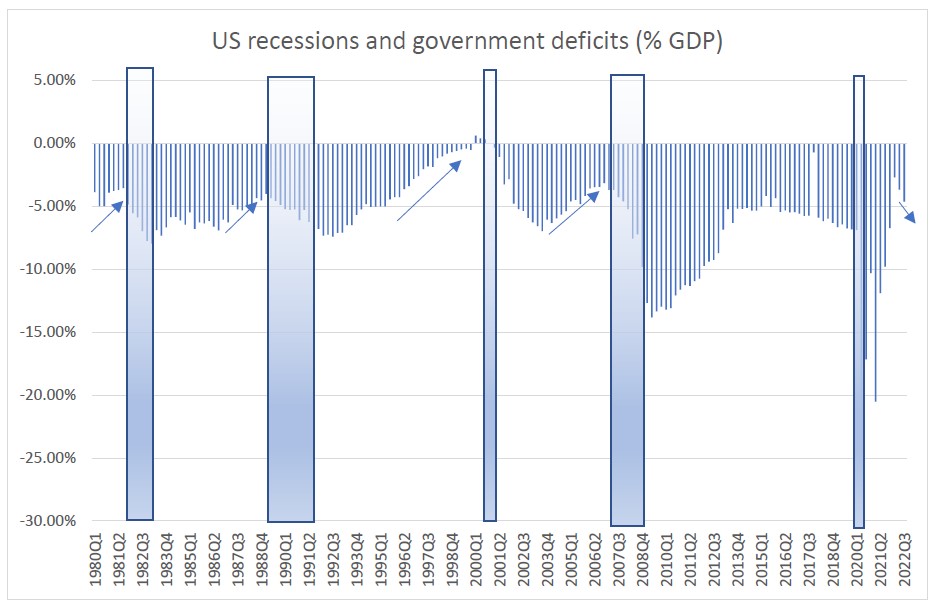
A very reliable recession indicator is predicting no recession in the US for 2023
Source: Federal Reserve (Z.1 tables), Quay Global Investors
What it means
In our last Investment Perspectives article, ‘The yield curve, recessions and soft landings’, we highlighted a well-known recession indicator (the inverted yield curve) and noted that the track record of the yield curve predicting recession is formidable.
The chart above is another indicator with an exceptional track record. The US tends to enter a non-COVID induced recession when the federal deficit is decreasing. That is, policies of fiscal contraction (higher taxes and/or lower spending) tend to lead to recessions. Conversely, fiscal expansion has not led to a recession since 1980.
This makes sense from a sectoral balances perspective, since government deficits support non-government savings and spending. The good news is, to the period ended September, the US deficit is growing again. Additionally, in the month of December, the deficit widened again to US$85bn compared to just $21bn in December 2021 (which led to GDP contraction the following quarter)[3].
Based on this data, no recession should be expected in the US any time soon.
And due to Fed “tightening”, US federal deficits are structurally increasing, supporting growth and jobs
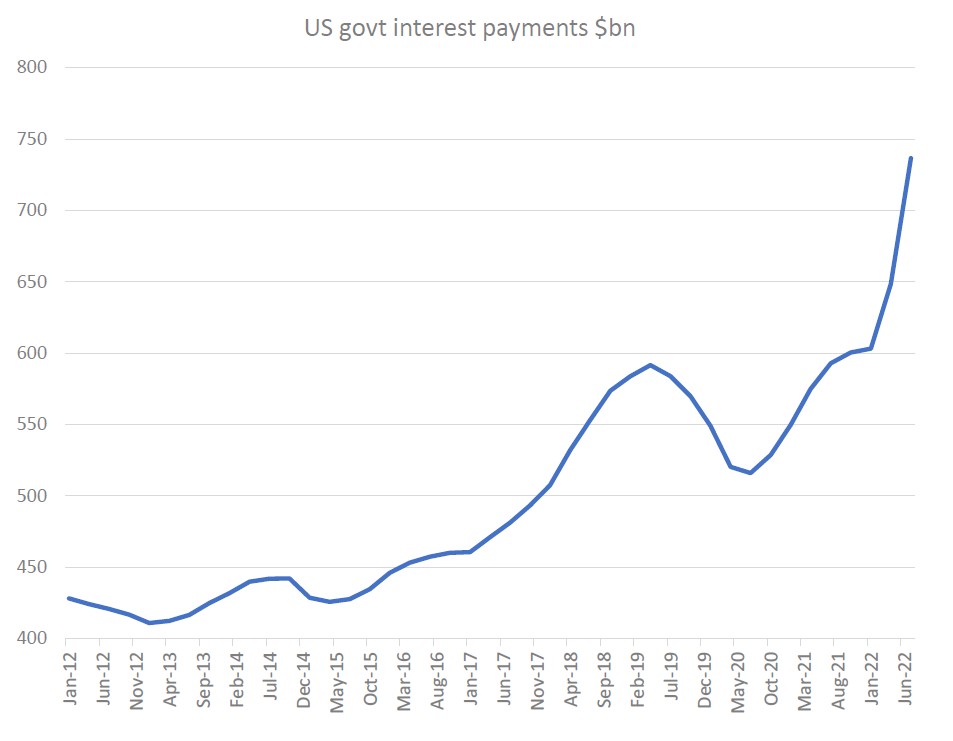
Source: St Louis FRED, BEA, Quay Global Investors
What it means
The US Federal government has over $31 trillion in issued bonds. As the Fed “tightens” monetary policy, they are (inadvertently?) providing a significant fiscal boost to the economy via increasing interest payments to the private sector, which in turn supports income, consumption and jobs.
For the period ended September 2022, the current annual interest payments of $750 billion are just shy of the government’s annual military expenditure of ~$800 billion. Assuming a sustained Fed policy rate of 5% (the current implied peak rate forecast), annual payments will surge to over $1.5 trillion, which is greater than the “one-off” 2021 COVID relief payments of $1.2 trillion.
These payments exclude the Fed’s interest payments on the $8.5 trillion of bank held reserves at the Fed (which is excluded from government budgets).
As per the previous chart, the US has not entered a recession during periods when the federal deficit was increasing. Thanks to central bank “tightening”, increasing budget deficits are almost guaranteed.
The US consumer is in great shape
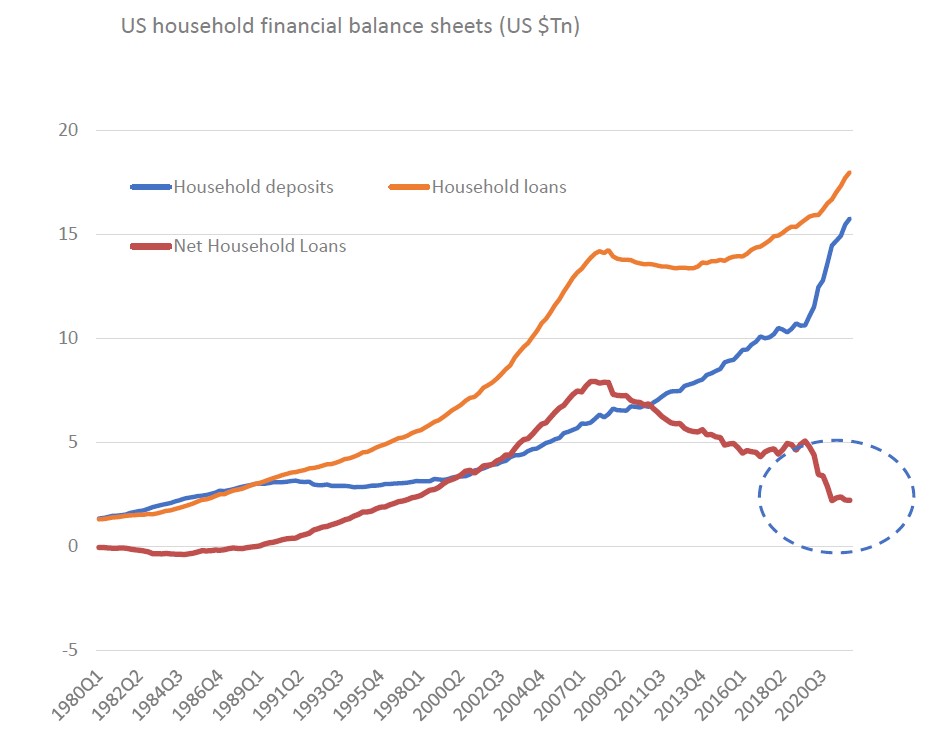
Source: St Louis FRED, BEA, Quay Global Investors
What it means
Despite an ongoing increase in household debt, the massive COVID-related fiscal spending (largely targeting households) has seen a corresponding surge in household financial deposits. In net debt terms, the US household balance sheet have not been in such good shape since the early 1990’s.
Moreover, around two thirds of household debt are mortgage-related, which in turn are almost entirely fixed (90%) for 15-30 years. Yet, interest on deposit accounts is rarely fixed. Monetary policy, even at the household level, could well be acting as stimulus.
And Aussie households did not miss the party
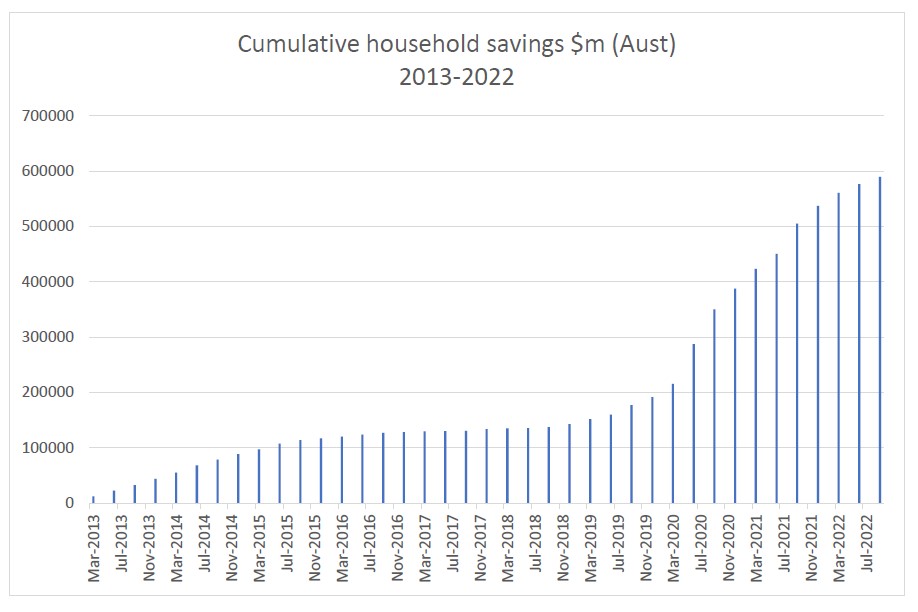
Source: ABS, Quay Global Investors
What it means
Over the past few quarters, the household savings rate has declined significantly. In the latest national accounts data, the rate has declined from a peak of 23.6% to 6.9%[4].
It’s worth remembering the “savings rate” is the rate in which new savings (flow) are added to existing savings (stock). Additionally, the stock of cumulative savings has increased significantly since 2020 (due to fiscal transfers), and are well ahead of pre-COVID trend.
Much like the US, it means households with more cash on hand are better placed to withstand near-term declines in assets values (housing, equities) without impacting consumption. Combine this with evidence inflation is likely to return to central bank targets without a recession, Australia may also be a candidate for a soft landing.
Third year presidential returns are best in the US
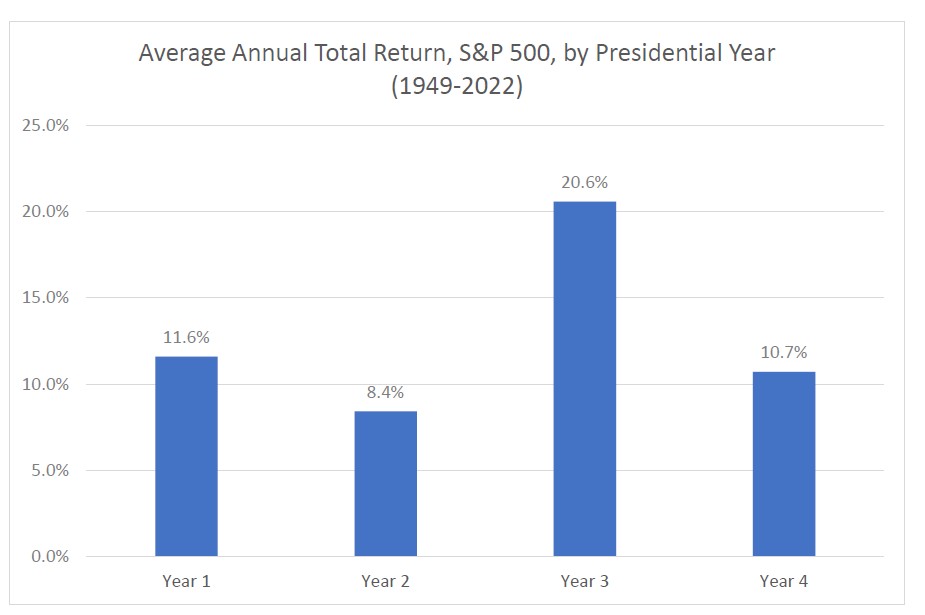
Source: slickcharts.com, Quay Global Investors
What it means
This year is the third presidential year for Joe Biden. Analysing data from the S&P 500 over the past 74 years shows there is (on average) better returns during the third year of a presidential term versus any other time.
There are probably a few reasons for this. One may be that the election of the second congress (which traditionally is the opposite party to the one holding the presidency) ensures there are more restrictions placed on the administration – letting earlier policies play out and allowing American enterprise do what it does best; innovate and grow. It could also be presidents increasing spending, setting themselves up for the next year’s election. Whatever the reason, history supports a strong equity bounce in 2023.
The European energy crisis that wasn’t
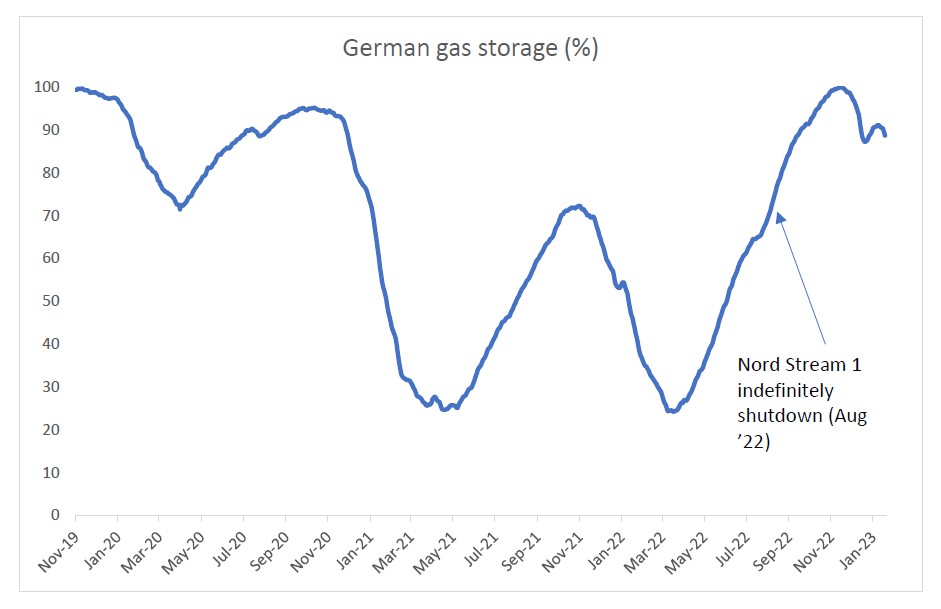
Source: Gas infrastructure Europe, Bloomberg, Quay
What it means
After the invasion of Ukraine by Russian forces, which in turn were condemned by NATO, there was reasonable concern that Germany’s reliance on Russian gas compromised its energy security. At the time, Germany sourced around 55% of its gas from Russia, mainly via the Nord Stream 1 pipeline. After running several months below capacity during the northern summer, the pipeline was indefinitely shut down in late August. Just months from the northern winter, there was widespread fear of a significant energy crisis in Germany, affecting industry, jobs and the economy.
By November, Germany completed construction of its first floating LNG terminal[5], secured new LNG contracts, and by January 2023 a second LNG terminal was opened, with several more under construction[6].
The result is record high storage levels for mid-winter driving down spot gas prices (positive for lower inflation across the UK and continent) and permanently weaning Germany away from Russian energy reliance.
The content contained in this article represents the opinions of the authors. The authors may hold either long or short positions in securities of various companies discussed in the article. This commentary in no way constitutes a solicitation of business or investment advice. It is intended solely as an avenue for the authors to express their personal views on investing and for the entertainment of the reader.
[1] https://www.calculatedriskblog.com/2023/01/rents-continue-to-decline-more-than.html
[2] https://www.abs.gov.au/methodologies/monthly-consumer-price-index-indicator-methodology/nov-2022
[3] https://edition.cnn.com/2023/01/12/economy/us-government-budget-deficit-december/index.html
[4] https://www.abs.gov.au/statistics/economy/national-accounts/australian-national-accounts-national-income-expenditure-and-product/sep-2022
[5] https://www.theguardian.com/world/2022/nov/15/germany-completes-construction-floating-lng-terminal-liquefied-natural-gas-energy
[6] https://abcnews.go.com/Business/wireStory/germany-opens-2nd-liquefied-natural-gas-terminal-96436420