


It is likely that there have been a few culprits for this stellar performance, including record low interest rates, healthy household balance sheets, and perhaps a new desire to re-invest in the home as some workers contemplate an extended ‘work from home’ environment.
To be fair, the uplift in residential prices is not a local event. The value of homes has soared across the world, including New Zealand (+27.6%), the United States (+19.1% to October), the UK (+10.0%) and even places like Turkey (+40.0% to October). And for those who believe interest rates drive property prices, the average key interest rate in Turkey during 2021 was 18% (up from 11% in 2020).[2]
As we head into 2022, there is an expectation that interest rates are likely to rise around the world in response to recent inflation data. That may be true. However, we do not believe this will be enough to stop the gains – in fact, rising rates may indeed add to further gains (as per Turkey). The biggest risk for investing in residential property is, as always, excess supply.
The housing cycle
While there are many theories as to what drives house prices (ranging from interest rates and lenient tax rules to immigration), residential property prices ultimately mean-revert around replacement cost. As prices increase above the ‘cost to build’ there is almost always a supply response, as developers try to cash in on the margin. Ultimately, increasing supply dampens prices back to a level where supply is restricted – and the cycle starts all over again.
So, is the surge in residential property prices causing a supply response? In Australia, the answer is an emphatic yes.
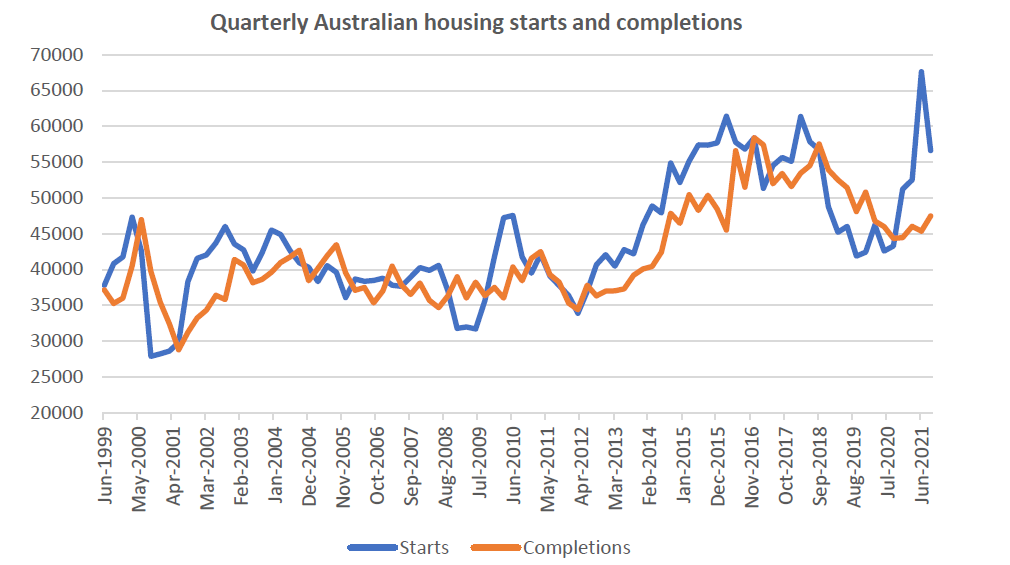
Source: ABS, Quay Global Investors
The surge in new housing starts since COVID is similar, albeit sharper, to the 2015-2018 cycle which ultimately saw prices correct in 2019. We have yet to see any heat come out of the Australian market – completions have yet to increase as they lag starts by around a year. Inevitably, completions will surge this year to match the starts, which may be somewhat ominous for the Aussie housing market.
Quantifying the oversupply (if any)
A surge in supply is not always a bad sign. The critical question is whether there is more total housing stock relative to overall housing occupier demand. To answer this, we will need to quantify the magnitude of the potential oversupply, if there is any. This is always a difficult task, as it not only relies on supply data but also household formation data, which can be notoriously fickle.
We can get a general sense of any imbalances using historical trend data. For example, Australian household starts ran at a consistent 40,000 per quarter between 2000-12, which appears to reflect a balanced housing market (no acceleration or deceleration in supply). Post 2012, supply accelerated as immigration increased. Adjusting for the increase in annual immigration from 1.4% per annum (2000-2011) to 1.7% per annum (2011-2019), steady-state supply can be estimated at ~50,000 per quarter, being household starts of 40,000 increased pro-rata with a higher immigration rate.
Using this assumption and based on housing starts data, we can estimate the cumulative supply shortfall since 2010.
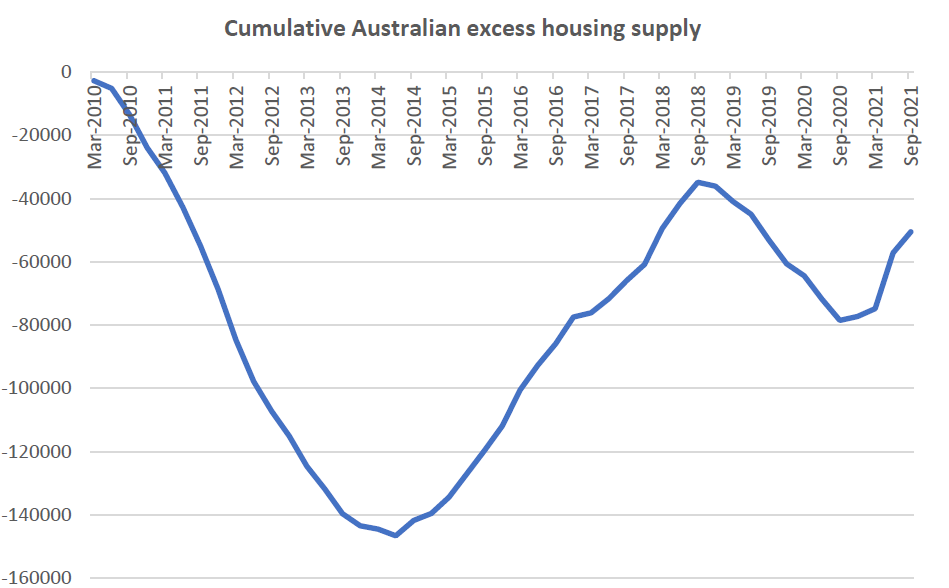
Source: ABS, Quay Global Investors
Generally, the Australian housing market has defied most gloomy predictions. Indeed, there was almost a small cottage industry dedicated to predicting the imminent collapse of Australian house prices in the post-financial crisis world. However, the chart above demonstrates that there has never been a situation where there has been excess supply of housing in Australia. Accelerating housing starts (as prices rise above replacement cost) were quickly absorbed by new households.
For Australia, population growth has generally provided Aussie housing the ultimate ‘get out of jail free card’ just as the market begins to cool. We made a similar observation in our June 2019 article What now for residential property?, where we reversed our earlier bearish 2017 call.
However, with COVID, population growth effectively halted right at the time supply was accelerating. For example, if we were to reduce our household growth assumption to 20,000 per quarter (60% reduction), the residential market would quickly become oversupplied (once current projects complete later in 2022).
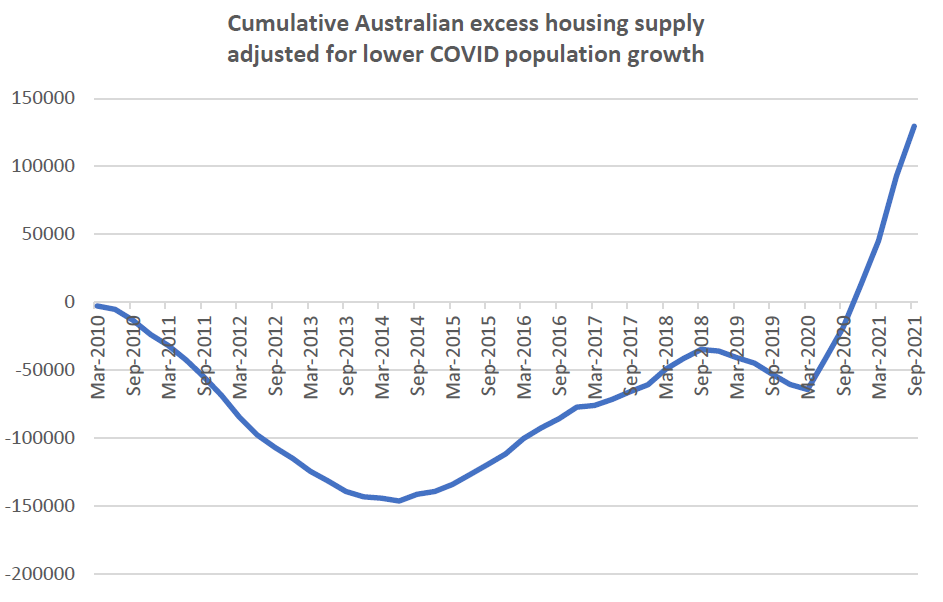
Source: ABS, Quay Global Investors
We don’t believe it is time to call for a market correction just yet, but based on the above chart it seems unlikely recent national residential price growth will be repeated in 2022.
What about the US?
Recent strong increases in US residential property prices have also come with a surge in new supply, in both houses and apartments.
![]()
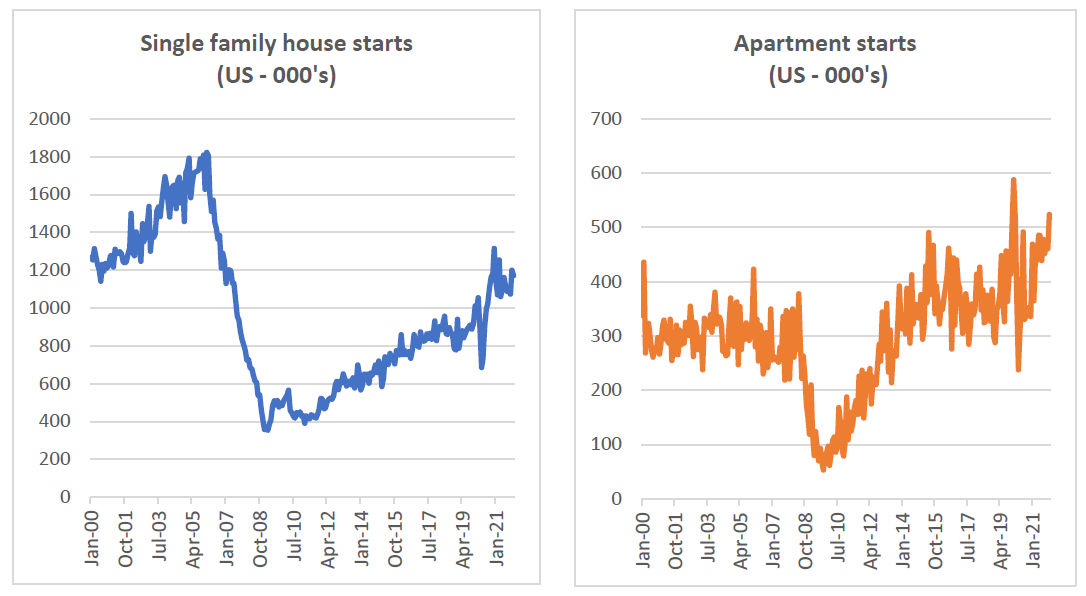
Source: St Louis Fred, Quay Global Investors
Does the US face the same supply headwinds as Australia? To answer, we have applied the same methodology as the Australian analysis above. Specifically:
- We have assumed a normal supply run rate of:
o 1.2m single family homes per annum (consistent with pre-GFC bubble average)
o 0.3m apartments per annum (consistent with pre-GFC bubble average), and
- We have also assumed this required supply falls by 60% from mid-2020 to account for the collapse in immigration[3].
The following charts reflect the result for each sector.
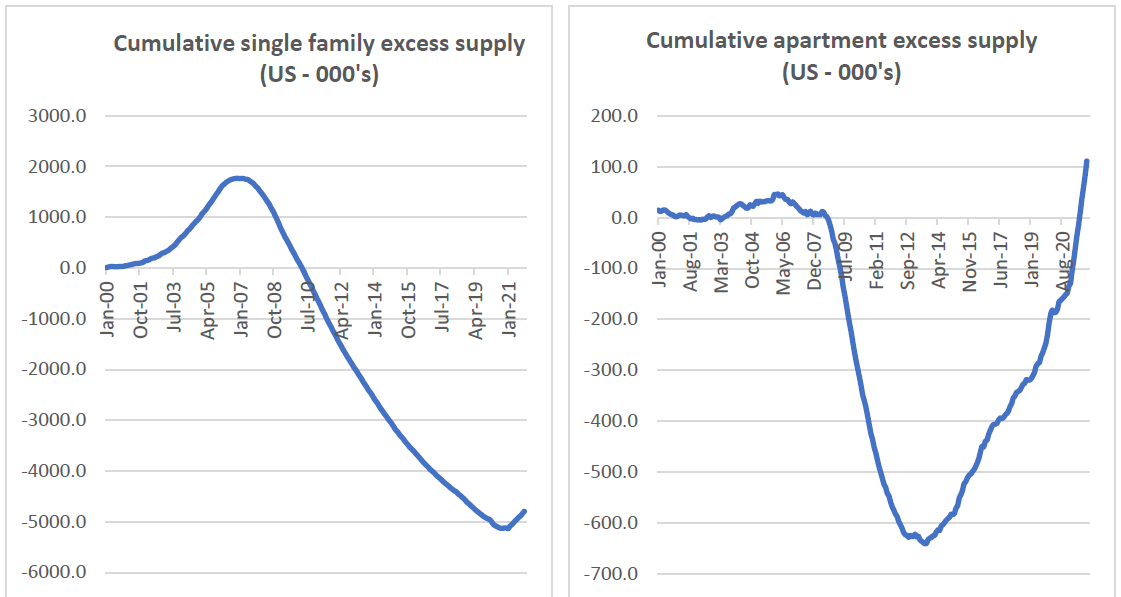
![]() Source: St Louis Fred, Quay Global Investors
Source: St Louis Fred, Quay Global Investors
For single family, there was a significant increase in excess supply leading to the financial crisis, which offers no surprise since prices boomed and were well above replacement cost. However, the single-family sector was crushed post crisis in terms of price (and ultimately resources), resulting in a significant deficiency in supply – even after allowing for the pandemic-induced collapse in immigration.
Conversely, US apartments never felt the effects of excess supply in the lead-up to the financial crisis. Also, unlike single family homes, apartment supply recovered more quickly in response to the demographic demands of millennials leaving home in the first half of the 2010s. However, with the decline in immigration there appears to be a growing risk that apartments are moving into excess supply for the first time in decades.
Concluding thoughts
The boom in global residential prices is another side-effect of the pandemic that seems to have caught many by surprise (us included). With any residential boom come concerns of a ‘new bubble’ and imminent crash. This type of reaction is understandable, given the deep scars left from the financial crisis a decade ago.
But by digging into the data, it is clear not all markets face the same risk. The cumulative undersupply in US single family housing is still significant and may take many years to rectify – especially now the sector has a demographic tailwind with the millennials, the largest US demographic cohort, seeking a more stable accommodation to marry and raise a family in a home.
The outlook for US apartments and Australian residential is less sanguine. For the first time in decades, there is a real risk these markets are facing a headwind of persistent oversupply, exacerbated by pandemic-induced immigration declines.
A word of warning: this analysis is not meant to be all encompassing and each market has its own subtleties and nuances. To be clear, we are not necessarily predicting a ‘crash’, or even a correction in these markets. The investment market is littered with the dead bodies of housing perma-bears.
But it seems clear from the data that right now that one of the best risk return profiles is in US single family housing – which is where the fund maintains a significant investment position. We are more than happy to remain long.
[1] www.abc.net.au/news/2022-01-04/australia-house-prices-corelogic-data-december-2021/100737080
[2] countryeconomy.com/key-rates/turkey
[3] There is no specific rationale for supply to decline by 60%, except to reflect that we think some adjustment needs to be made to account for the fact that new household formation would be significantly lower in a near-zero immigration economy.
The content contained in this article represents the opinions of the authors. The authors may hold either long or short positions in securities of various companies discussed in the article. This commentary in no way constitutes a solicitation of business or investment advice. It is intended solely as an avenue for the authors to express their personal views on investing and for the entertainment of the reader.