


Déjà vu?
Fast forward to the present day, when we live in a financial environment seemingly facing many of these same trends. House price growth post pandemic has been historic in both magnitude and speed. Inflation is high, and appears stubborn. The Fed is expected to continue to lift interest rates aggressively. For many investors this is like Groundhog Day of the GFC. Fear, particularly around US house prices, is circulating widely.
First, a refresher on the GFC
The main driver of the GFC was the US subprime mortgage crisis, which in turn became a household balance sheet crisis (too much debt against falling asset values). In the US, house prices grew strongly for years in a regulatory-light environment where mortgages were handed out to almost anyone who wanted one – including borrowers with bad credit scores and/or no income, no job, no assets (‘NINJA’ loans) – with no down payment necessary.
In many respects, it was peak euphoria; sustained house price growth drove increased demand for mortgage finance as speculation and fear of missing out increased. Financial markets met this demand by aggressively handing out new loans, and subprime loans were securitised into bonds which became an in-demand investment product. Loose lending practices meant more money flowing into the housing sector, driving up house prices. It seemed like an ever-upward spiral. Crucially, supply of new housing (construction) also spiralled as development margins swelled.
In mid-2004, the Fed began their interest rate hiking cycle. This not only curtailed the quantum of new lending, but also increased repayments for borrowers on variable rate mortgages. In many instances, borrowers did not have the cashflow capacity to meet the higher repayments. In fact, many borrowers did not set out with a plan of repaying their loans over the long term, instead banking on flipping their property for a profit in a few years’ time. Of course, when the Fed rate ballooned from 1% to 5%, and their properties entered negative equity, many of these loans became delinquent.
Houses prices cratered as sentiment soured. Houses for sale increased and speculators disappeared. This not only affected lenders, but also tore up the US subprime mortgage bond market and the institutions heavily invested in these bonds. Shockwaves were felt all over the world across stocks, bonds, derivatives and the credit market.
What’s changed?
In 2010, the Dodd-Frank Wall Street Reform Act was enacted to promote the financial stability of the US, with an array of regulations imposed on financial institutions. One of the outcomes of the Act was the creation of the Consumer Financial Protection Bureau (CFPB), which aims to regulate mortgage lending standards and protect against predatory lending.
The change in the regulatory environment has meant the disappearance of NINJA and other high risk mortgage loans, a better-informed borrower and less risky lending for housing.
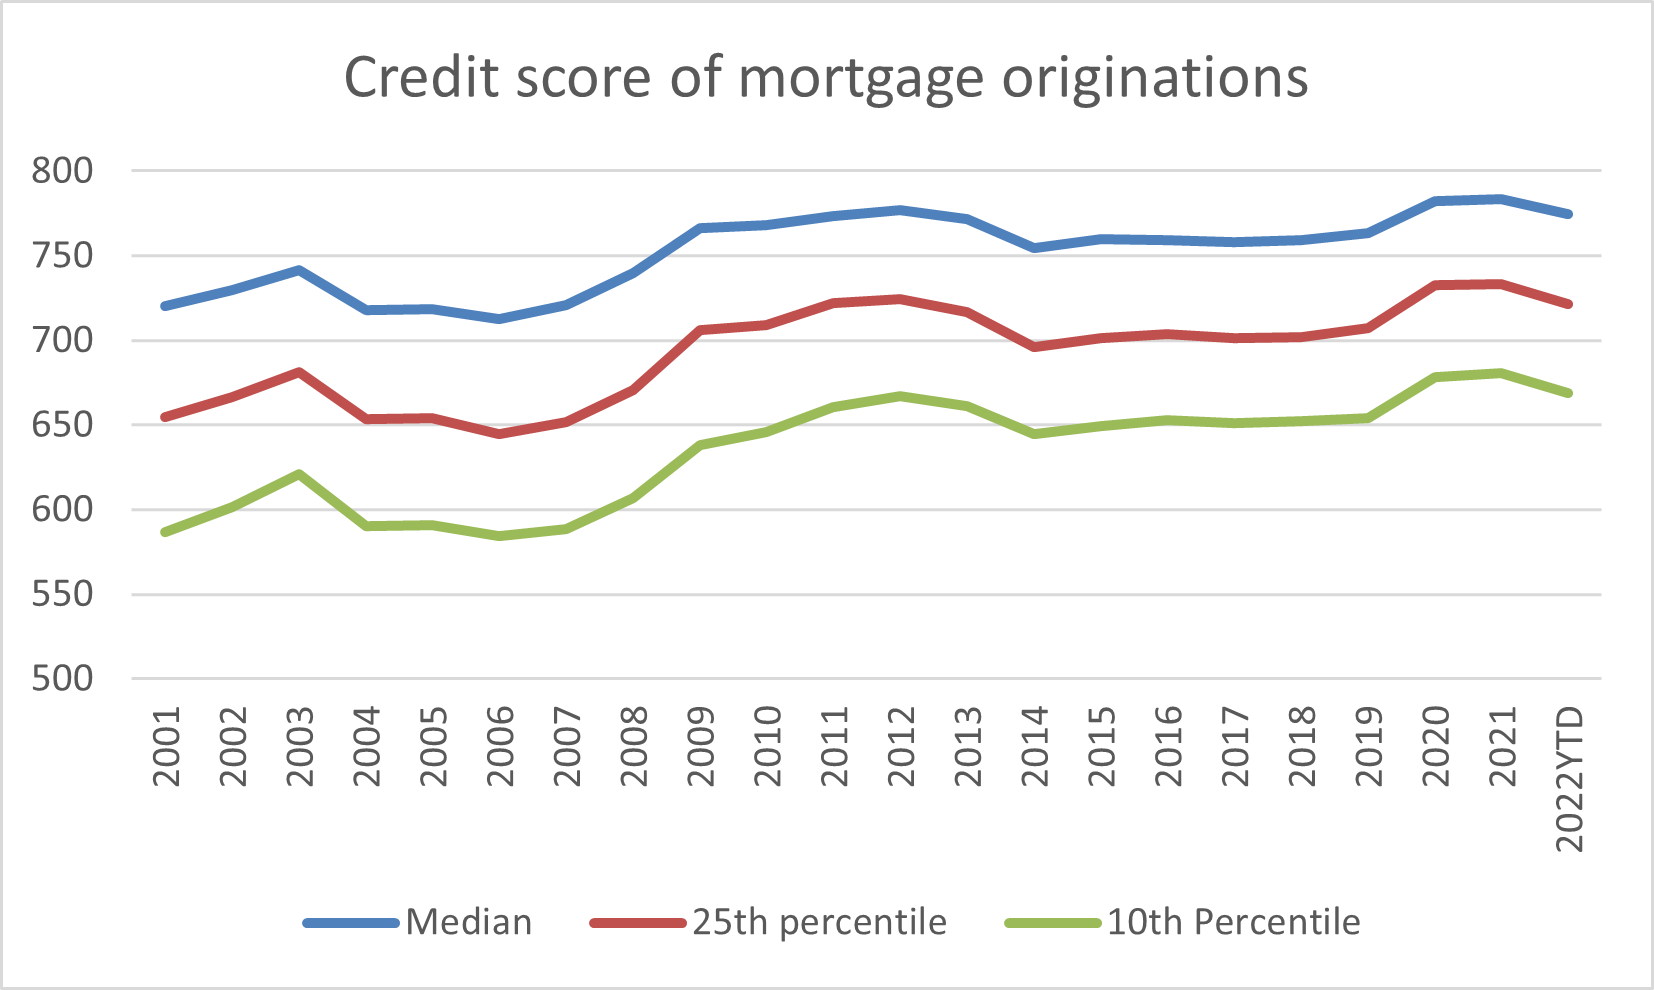
Source: New York Federal Reserve
The above chart shows the average Equifax credit score of mortgage borrowers originated by year. Prior to the GFC, the 10th percentile of mortgages was underwritten to borrowers with a credit rating score barely above ‘poor’ (<579). In the years since, there has been a marked improvement; most noteworthy, the increase in the median credit score to high 700s (‘very good’) and the 10th percentile of loans to borrowers with a score in the high 600s (‘good’).
In our view, this dramatically decreases the risk of a 2008-style event happening this time around.
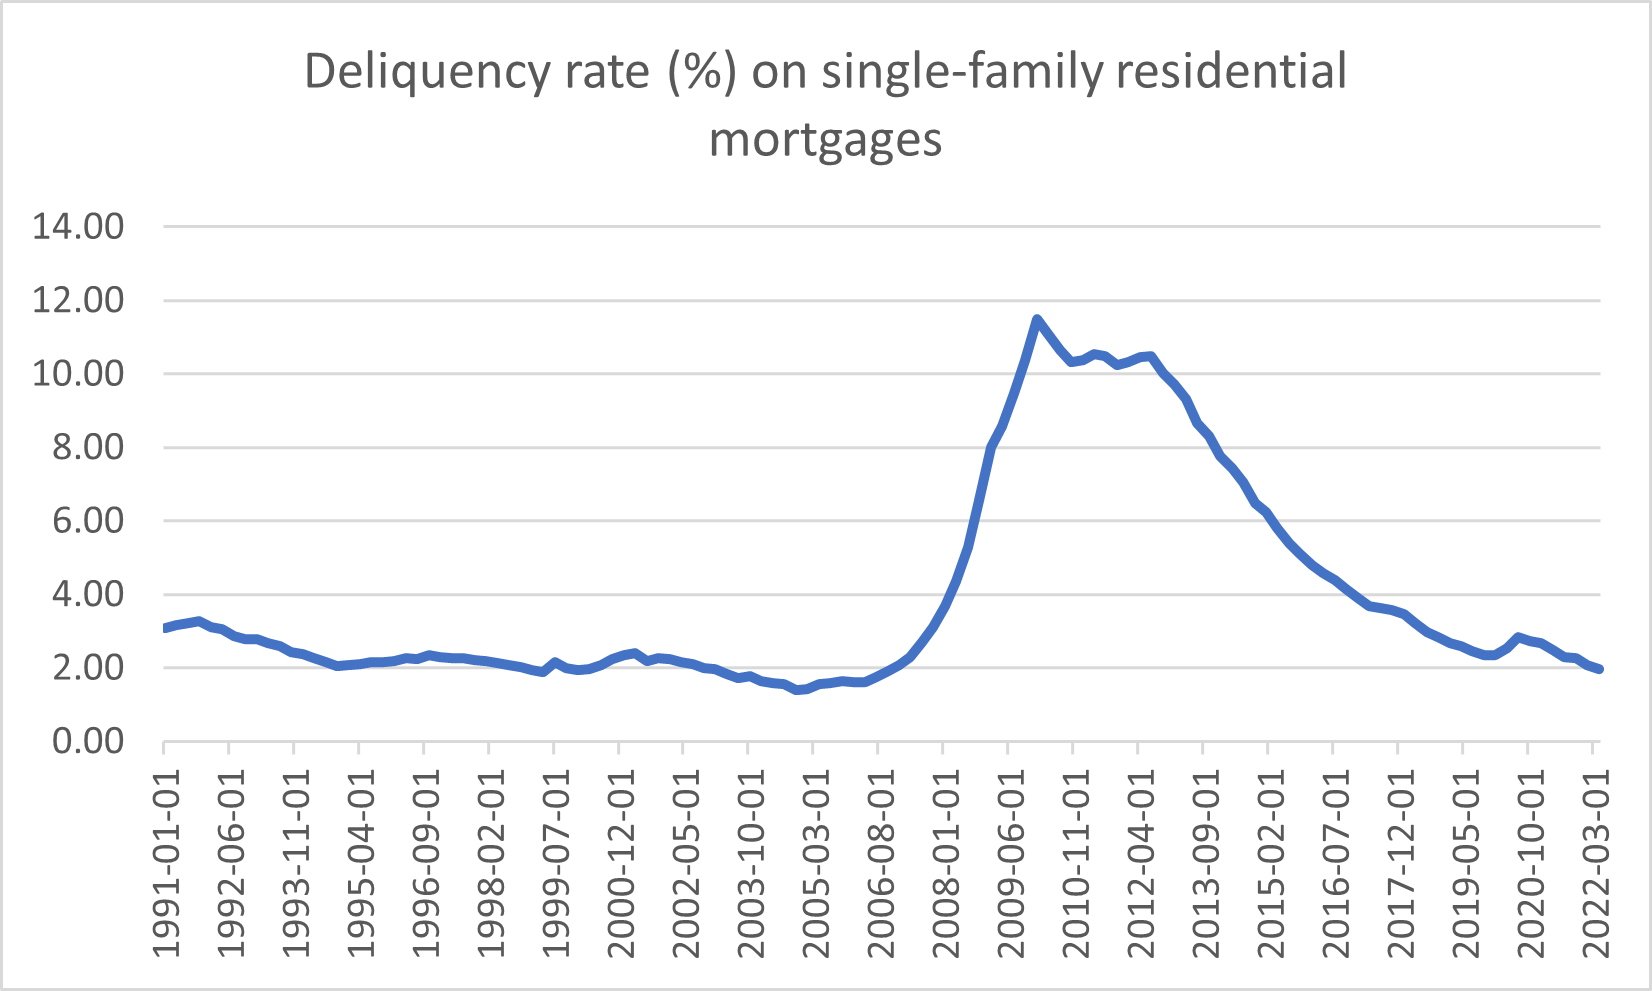
Source: US Federal Reserve
We can see this trend in the single family mortgage delinquency data, with the most recent data from April 2022 showing the delinquency rate has fallen below 2% to multi-decade lows. In fact, the last time it was sub-2% was in 2006. However, 2006 also tells us this number can shoot up quickly. By 2009, the delinquency rate was over 10%.
In our view though, a number of factors mitigate the risk of delinquency increasing both at the speed and magnitude of the GFC.
First, what we have seen since the GFC is a significant drop in the proportion of adjustable rate mortgages (ARM). Prior to the crisis, up to a third of mortgages written were effectively on a variable rate (or very short fixed term). At the time, these variable rate loans were also highly correlated with being a subprime borrower. Post GFC, ARM has been below 10%. Importantly, regulatory changes have meant that ARMs underwritten post-GFC have more stringent standards too.
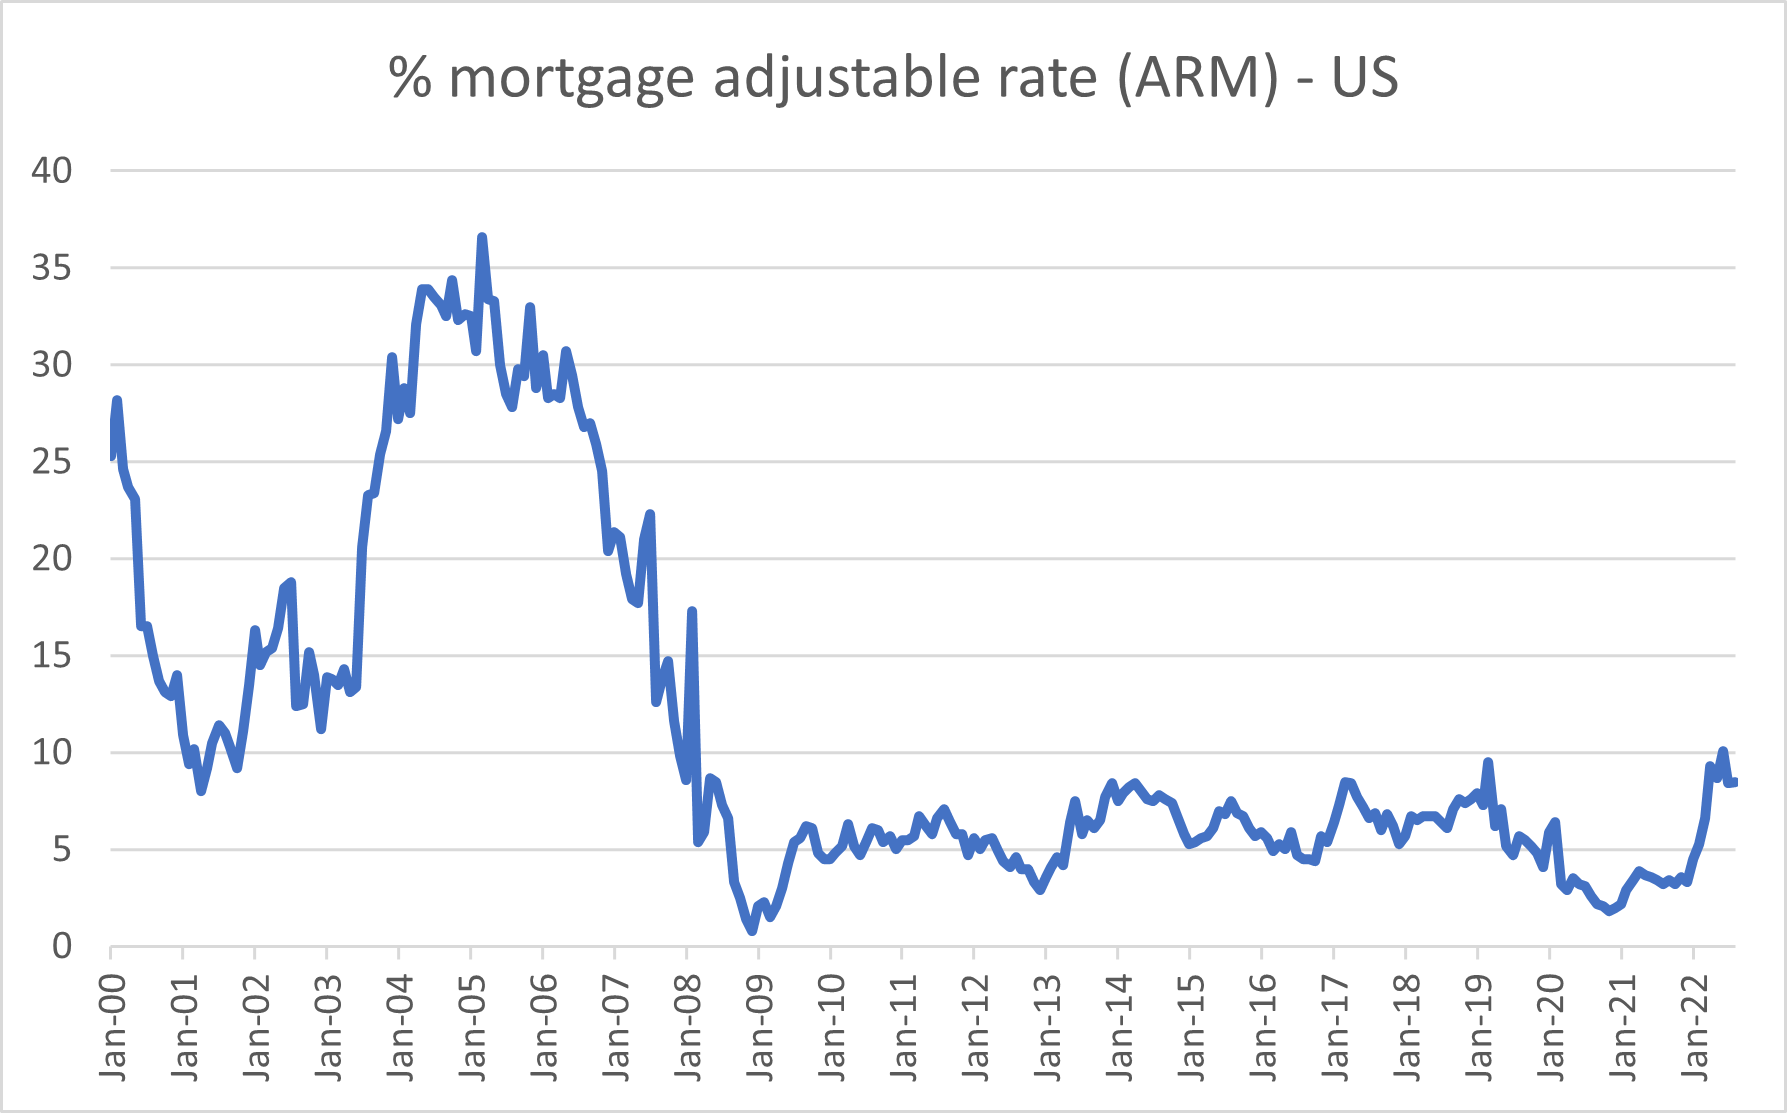
Source: US Mortgage Brokers Association
The outcome of the fall in the proportion of ARM loans has meant that the transmission mechanisms of interest rate rises by the Fed has far less of an impact on US housing than in the past. In the last decade, over 90% of new loans have been underwritten on a fixed rate mortgage of 15 or 30 years. These homeowners would also be sitting on significant equity. According to research by Black Knight, as at the second quarter of 2022 only 0.4% of homes are in negative equity. Even with a 15% price decline, this number would only forecast to increase to 3.7% - and almost the whole 3.7% would be made up of purchases in late 2021 and 2022. In 2008-09, the negative equity rate was over 20%[2].
Secondly, after the record levels of pandemic stimulus, US household balance sheets are stronger than ever. As discussed in last month’s Investment Perspectives article, Why interest rates aren’t working yet, US household net financial debt is back to 1996 levels. The household balance sheet recession that enabled the GFC in 2007-08 is high unlikely to occur again in the current environment.
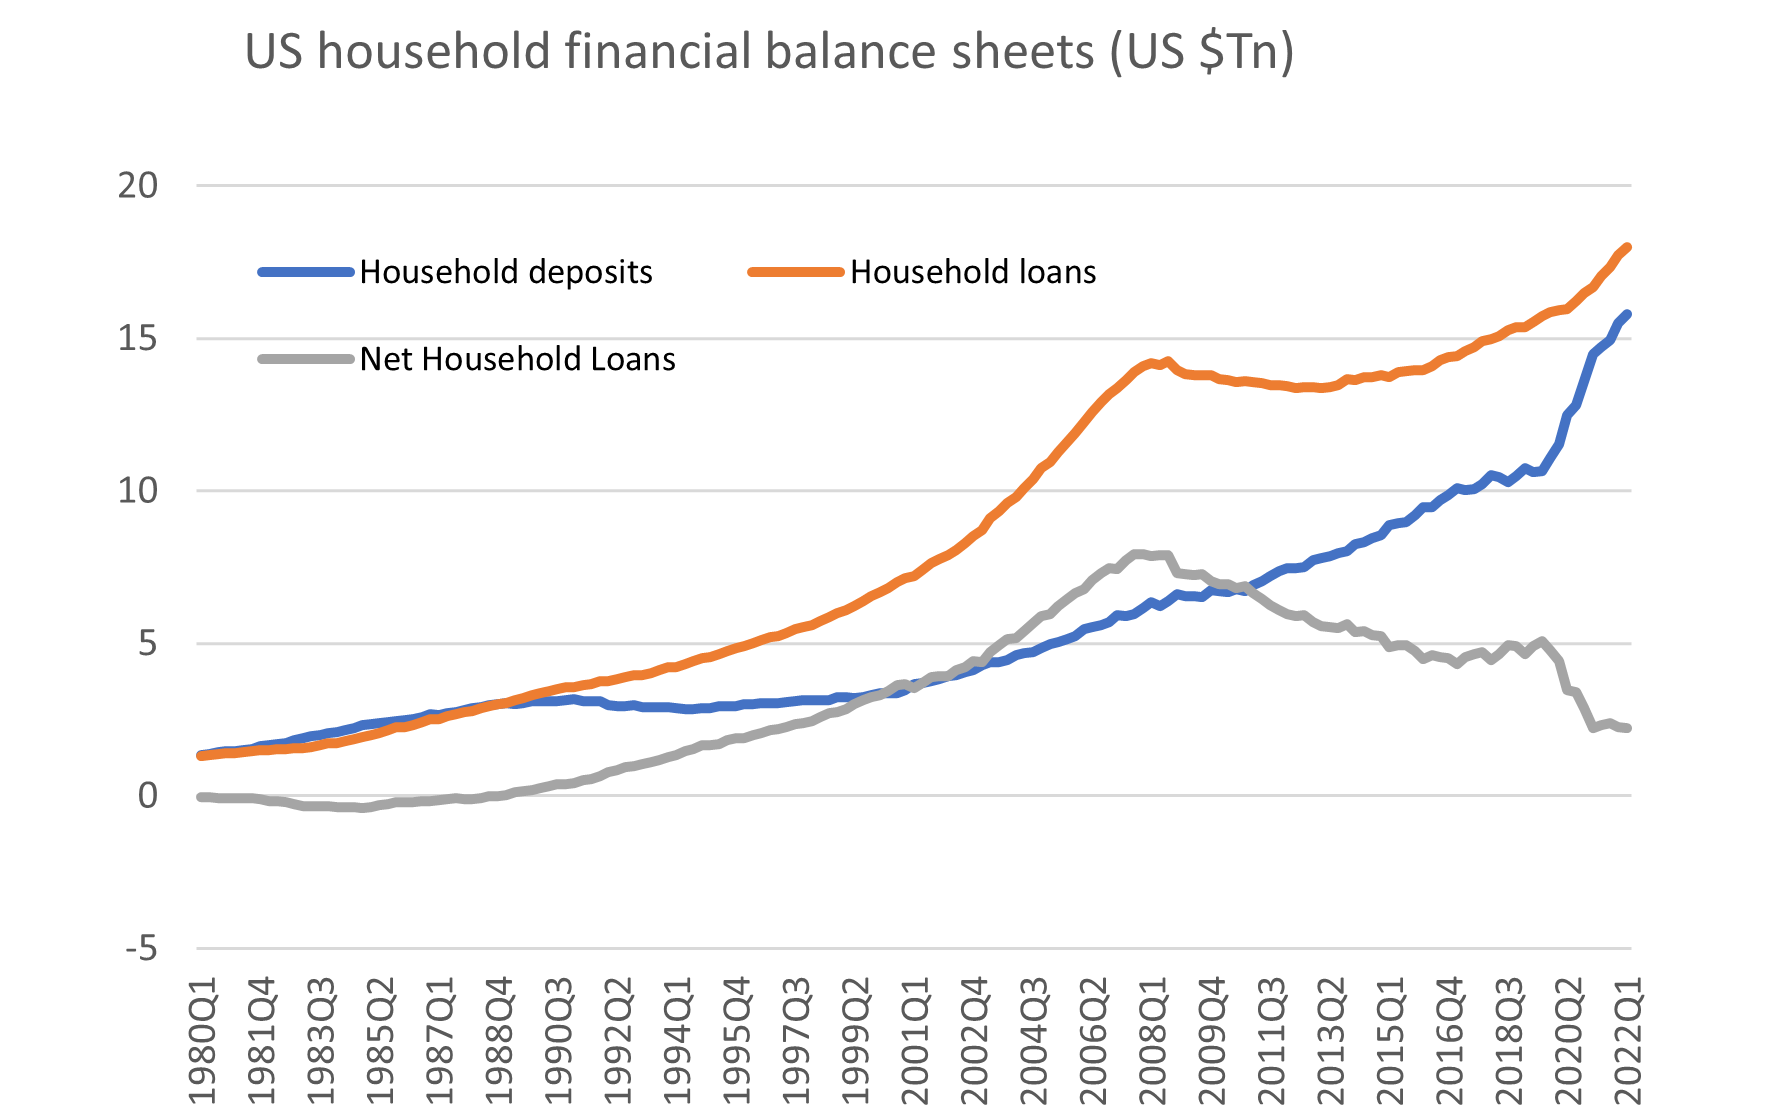
Source: St Louis Fred, US Federal Reserve, Quay Global Investors
Implications for housing
In our view, after weighing up the evidence, the possibility of a GFC style housing crash is unlikely. The housing market is in much stronger shape due to stricter regulation and lending practices. Delinquencies are near record lows and unlikely to spike. Household balance sheets are strong, the overwhelming majority of owners are in positive equity territory, and ~95% of all loans are fixed for 15-20 years.
Of course, in the short term, house prices could somewhat correct. House prices, like any other asset price, can be impacted in the short term by the cycle of market emotions. ‘Fear of missing out’ or the ‘fear of not getting out’ can swing prices one way or the other. In the long term, however, house prices will be driven by replacement cost, which for single family housing, continues to increase.
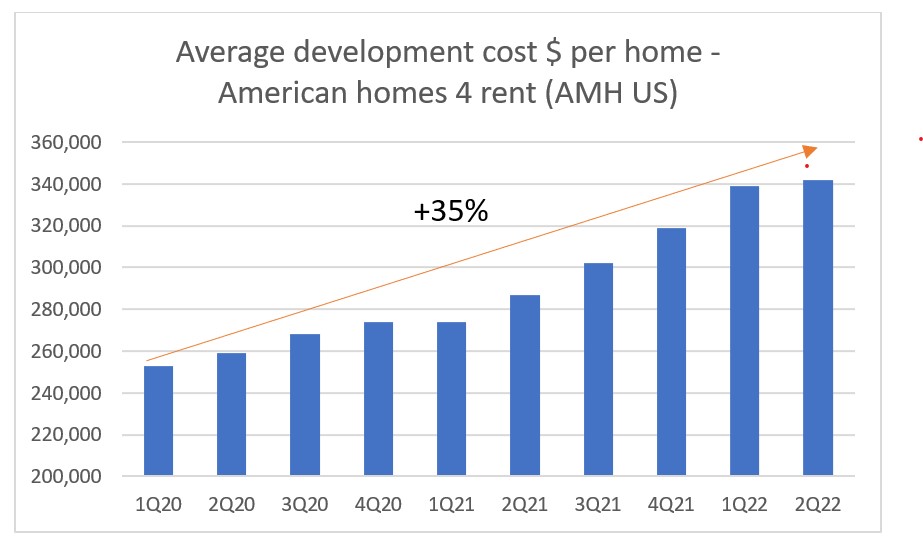
Source: American Homes 4 Rent
Another angle not spoken about enough, in our view, is the strength in rent. While a NAV investor may get jittery at the thought of downside risk to housing prices, for a cashflow-based investor high rental growth – and in particular the durability of high rent – is exciting news. We can discern whether rental growth is durable by examining the gap between the demand and supply of housing.
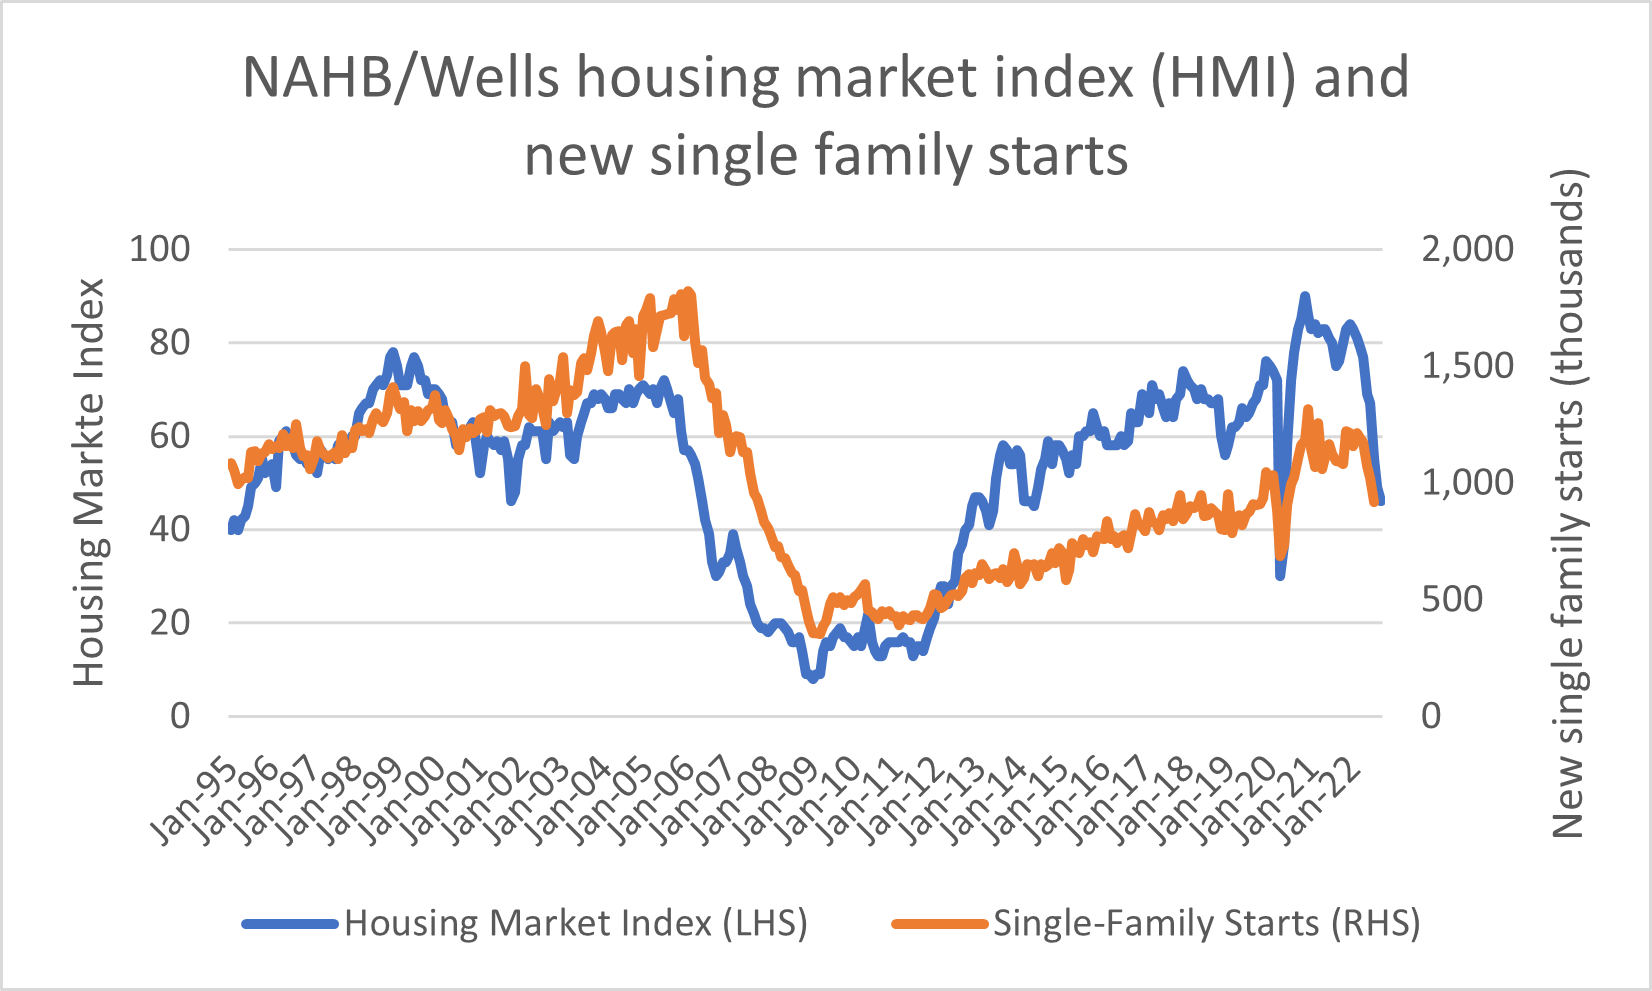
Source: National Association of Home Builders
We believe US single family housing is chronically undersupplied, with housing starts post-GFC not sufficient to meet growth – both for overall population and the proportion of family-forming millennials. Starts data in recent months have also fallen dramatically, adding to the future gap. Homebuilder sentiment has soured, with the NAHB housing market index falling to 46 in September 2022 (a rating under 50 is considered low).
Rent, unlike house prices, is in our opinion a more accurate reflection of the underlying demand for housing against available supply, as the element of emotion is absent.
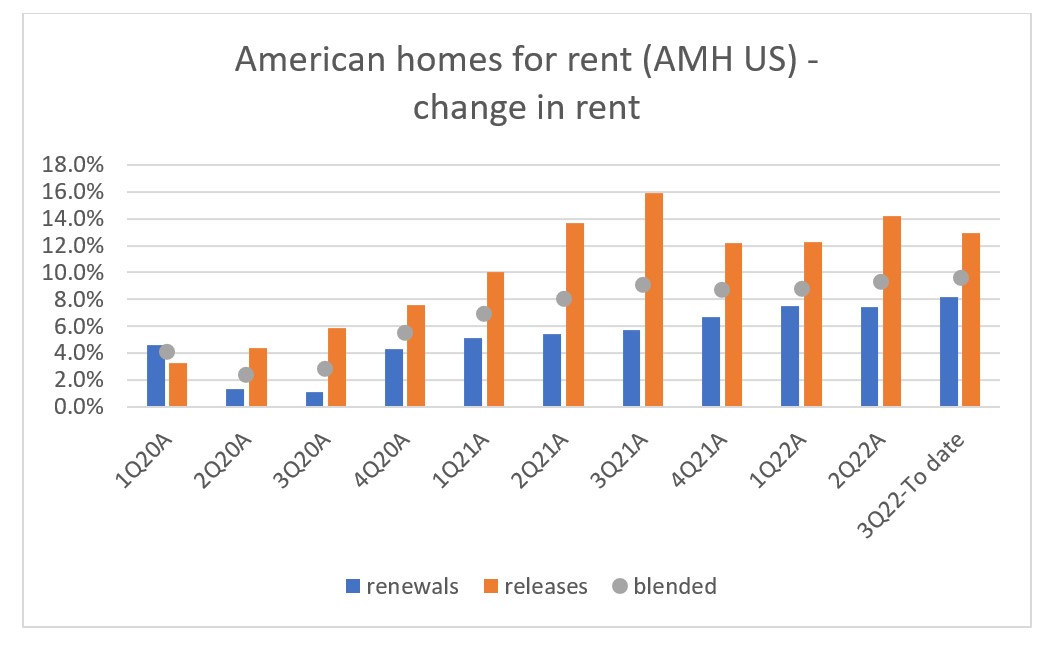
Source: American Homes 4 Rent
The above chart shows rental growth on leases signed for one of the largest single family housing landlords in the US. What we see is clear evidence that housing demand is greater than available supply. With interest rates rising, building confidence low and new starts falling off, the gap will only grow larger. This bodes well for future rent and housing landlords prospects going forward.
Rent in US single family housing (highlighted in orange in the chart below) is also on the affordable end of the market compared to US apartments. This factor, combined with the undersupply dynamic, will add to the resiliency of the sector.
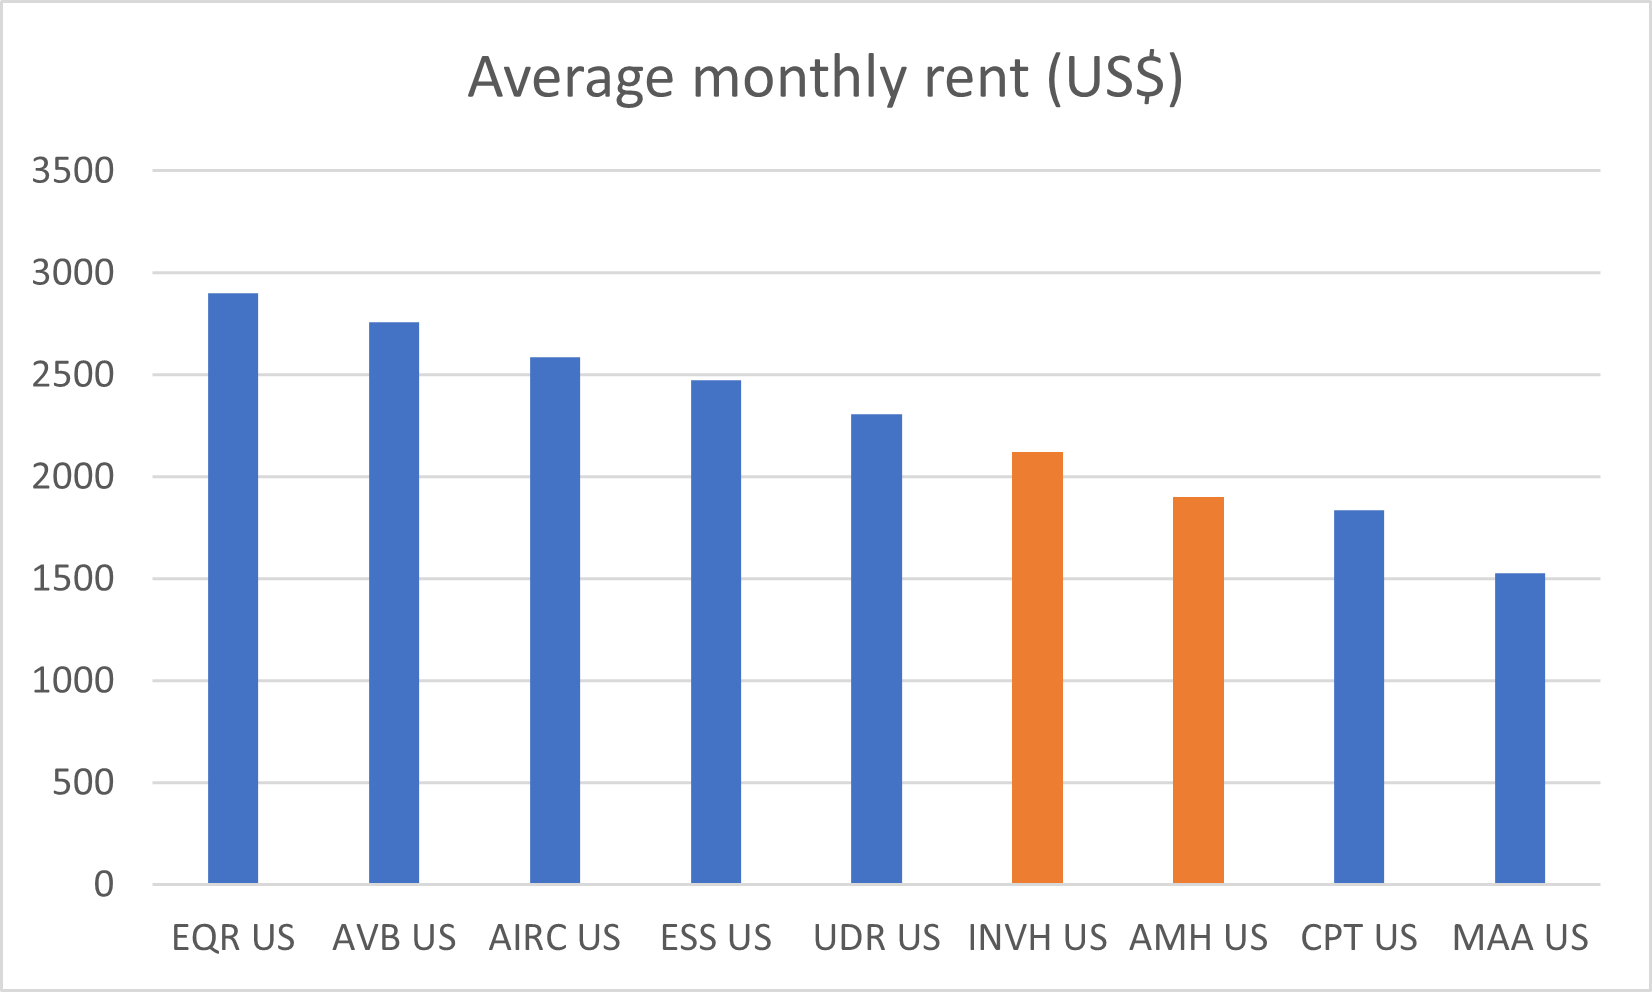
Source: Company reports
Finally, it’s pertinent to note that US housing rent has been remarkably resilient, even in downturns. Digging into historical US CPI data, we have calculated the % change year on year of rent of primary residence in US cities. Since the turn of the century, rent measured by the US Bureau of Labour Statistics’ survey has only fallen three times year on year – in May, June and August 2010 (circled in red in the chart below). In these cases, the fall has effectively been near 0%. In fact, rent was still growing in 2007 to 2009 (during the height of the GFC). Given the uncertainty in the economic outlook, this only adds to the attractiveness of the sector.
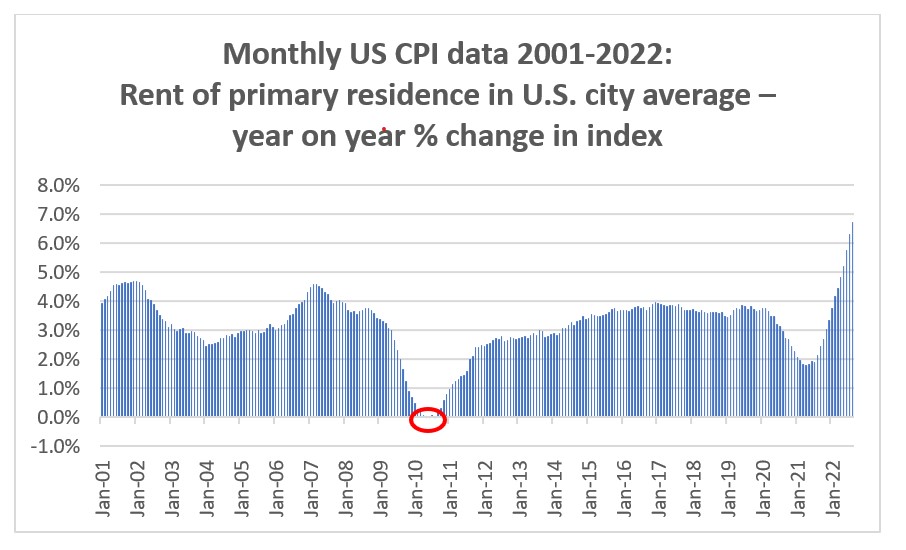
Source: US Bureau of Labour Statistics, Quay
Implications for housing
As is always the case, market volatility can create anxiety due to daily (negative) mark-to-market events. However, the same volatility can present investors with outstanding long-term investment opportunities.
Housing is largely non-discretionary, and is critical infrastructure in any modern economy. While recency bias from the GFC may cause fear, the negative impact on housing is not supported by the data in the current climate, especially for single family homes. In particular:
- Household balance sheets are in their best shape since the early 1990s
- 95% of all mortgages are fixed
- Credit standards have improved significantly
- Housing is undersupplied based on the collapse on new starts / deliveries since the GFC
- Threats of future oversupply are being eliminated by central bank actions, and rising replacement cost is ensuring the ‘breakeven price’ for new construction is significantly higher than current market prices, and
- Even during the worst housing crisis in a century and clear evidence of oversupply, rent and cashflows continued to grow during the GFC for single family homes.
At Quay, we have high conviction in the US single family sector based on these observations. We continue to maintain a meaningful exposure to the sector, and expect these investments to comfortably exceed our long-term investment objectives.
[1] S&P/Case-Shiller U.S. National Home Price Index
[2] Black Knight Real Estate, Inc.
The content contained in this article represents the opinions of the authors. The authors may hold either long or short positions in securities of various companies discussed in the article. This commentary in no way constitutes a solicitation of business or investment advice. It is intended solely as an avenue for the authors to express their personal views on investing and for the entertainment of the reader.