

However, we would argue that - at the extreme - these two asset classes could turn out to be highly correlated.
How so? Consider the following:
- more than 35% of the S&P/ASX 200 is represented by banks and other financials[1];
- approximately 60% of the banks’ assets are in residential mortgages[2];
- these mortgages have the same economic pay-off as a ‘written put option’ against residential values – the upside is the option premium (net interest margin) – the downside is the decline in asset values beyond the owner’s equity. This means that a meaningful decline in Australian property values will impact a large proportion of the Australian equity market at the same time;
- any stress in the Australian banking system from a decline in residential property will have a significant impact on the wider Australian economy and therefore a meaningful impact on the entire share market;
- if there is any meaningful correction in the Australian residential market, investors with a portfolio of Australian property and Australian shares are unlikely to have any diversification benefits at all.
It is at the extreme that diversification works best. In the scenario above, we see little diversification benefit from owning Australian residential property and Australian shares. For readers who think this scenario is impossible, we draw your attention to the following chart, which shows the strong upswing in new supply of Australian houses and units, well beyond the historic norm:
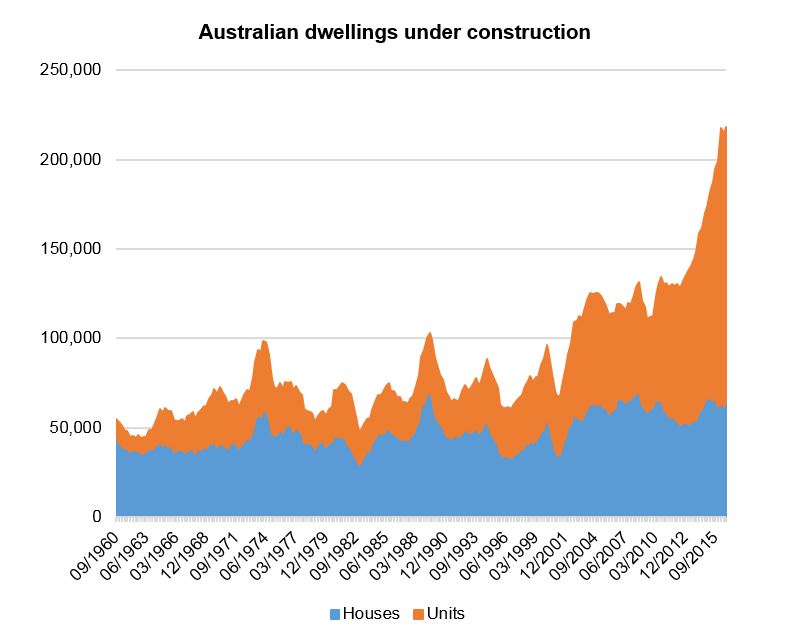
Source: Australian Bureau of Statistics (ABS), Quay Global Investors
Looking at correlation
An important aspect for portfolio construction is to allocate capital to un-correlated asset classes while maintaining an overall return objective. How does global real estate fit into a portfolio that may include Australian equities?
The following table, using monthly data over 17 years, highlights the long-term correlation between global real estate and eight other asset classes.
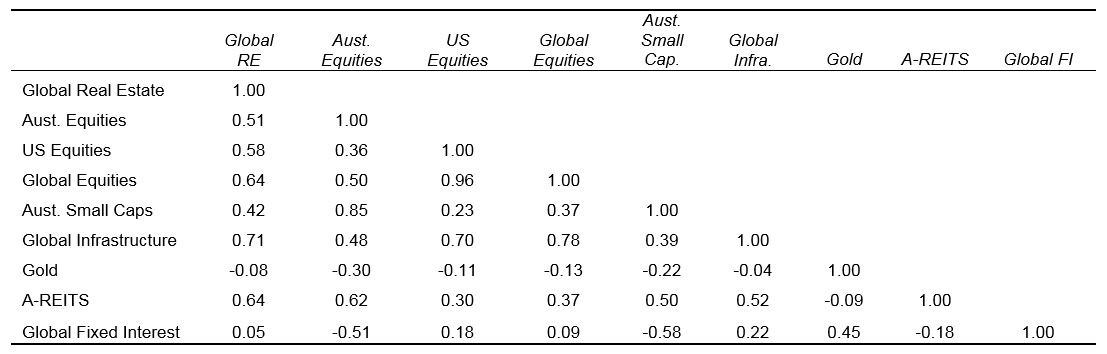
Source: Bloomberg, Quay Global Investors
From the table above, we notice that the correlation between global equities and Australian equities (0.50) is the same as global real estate and Australian equities (0.51). In other words, there is as much diversification benefit for an Australian investor to allocate to global real estate as global equities.
Secondly, global real estate has almost no long-term correlation with global fixed income (0.05). Despite conventional wisdom that real estate is a ‘bond proxy’, the low correlation indicates that holding both asset classes offers significant diversification while providing income-based total returns.
Thirdly, global real estate offers greater diversification against Australian equities (0.51) compared to Australian real estate investment trusts (A-REITs) (0.62).
What about risk?
At Quay, we define risk as the real loss of purchasing power over time. That is, sustained returns below inflation. For more on our thoughts on risk, please refer to our October 2016 Investment Perspectives, “Defining risk”.
Notwithstanding our view on risk, we are aware that at times, investors may need to access portfolio capital earlier than expected – which makes volatility (and draw-down) important.
There are times where volatility of global real estate is lower than other risk assets – and times when it is higher. But over the long-term, the standard deviation of returns (a measure of volatility) for global real estate is not significantly different to local or global equities.
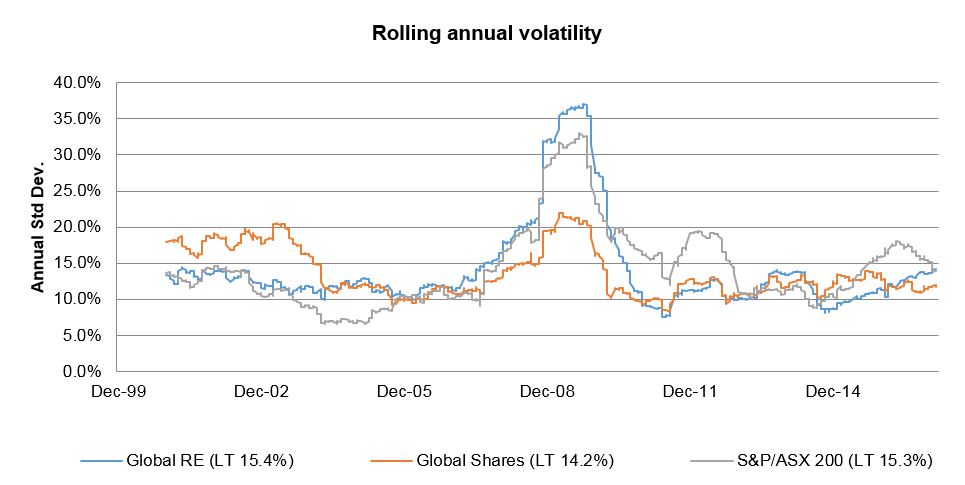
Source: Bloomberg, Quay Global Investors
Long-term returns are competitive…
Despite volatility not being significantly different to local and global equities, unhedged global real estate offers competitive returns, delivering a compound annual return of approximately 8.5%. This compares to an average Australian inflation rate of 2.7% over the same period. Using 17 years of data to 2016, we have taken a long-term perspective, allowing us to view risk and return through a full economic cycle. The period includes two US recessions (including The Great Recession) and the European debt crisis and associated recoveries.
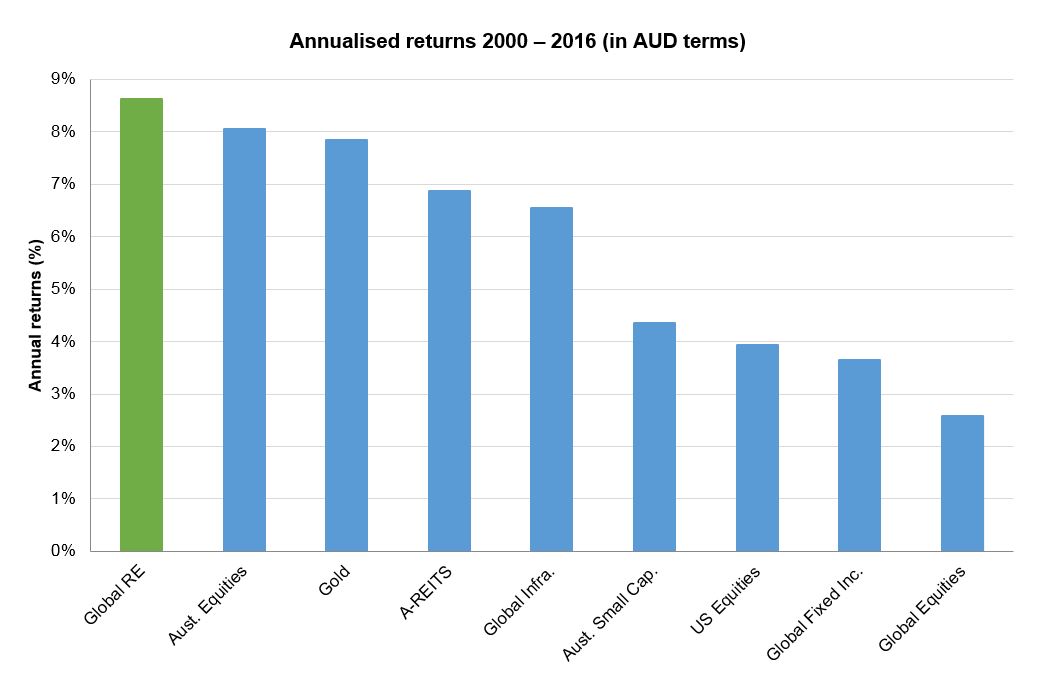
Source: Bloomberg, Quay Global Investors
Of course, there is always some debate as to the starting point for this type of analysis. A global equities manager would correctly point to the year 2000 as the peak of the ‘dot-com’ bubble. Having said that, we note that technology dominated US equities still outperformed global equities since 2000. We would also note that by looking at total returns from the worst possible time for Global Real Estate (from the peak of the property cycle in 2006), annual returns are only marginally lower (by 1%) relative to global equities.
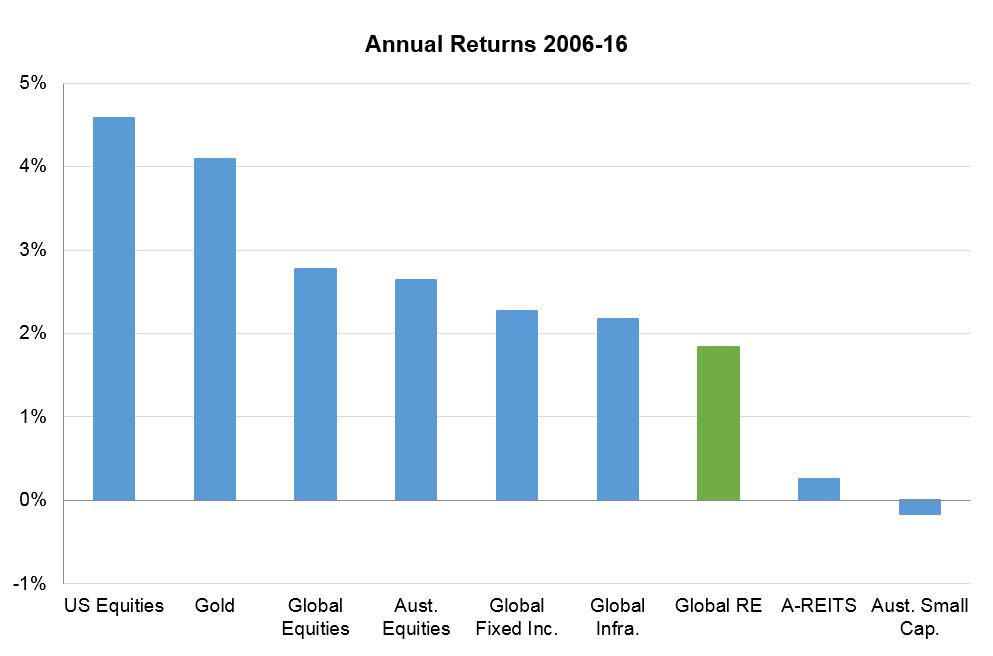
Source: Bloomberg, Quay Global Investors
…because they’re backed by real assets
In our view, one of the big advantages for real estate (and other real assets strategies), is that real estate companies grow by acquiring real assets. So long as leverage is managed, real assets rarely lose all of their value. Companies may pay too much – but the assets retain some value even under a worst-case scenario. The rate of obsolescence for institutional quality property is low. However, in the world of equity, operational leverage can turn seemingly sensible acquisitions to dust if there is any technology industry disruption (for example MySpace) or poor judgement (for example Slater & Gordon / Quindell). In our view, the risk of business obsolescence is greater than real estate obsolescence.
Another way to assess performance is to analyse annual results. The following matrix ranks sector performance on a calendar year basis.
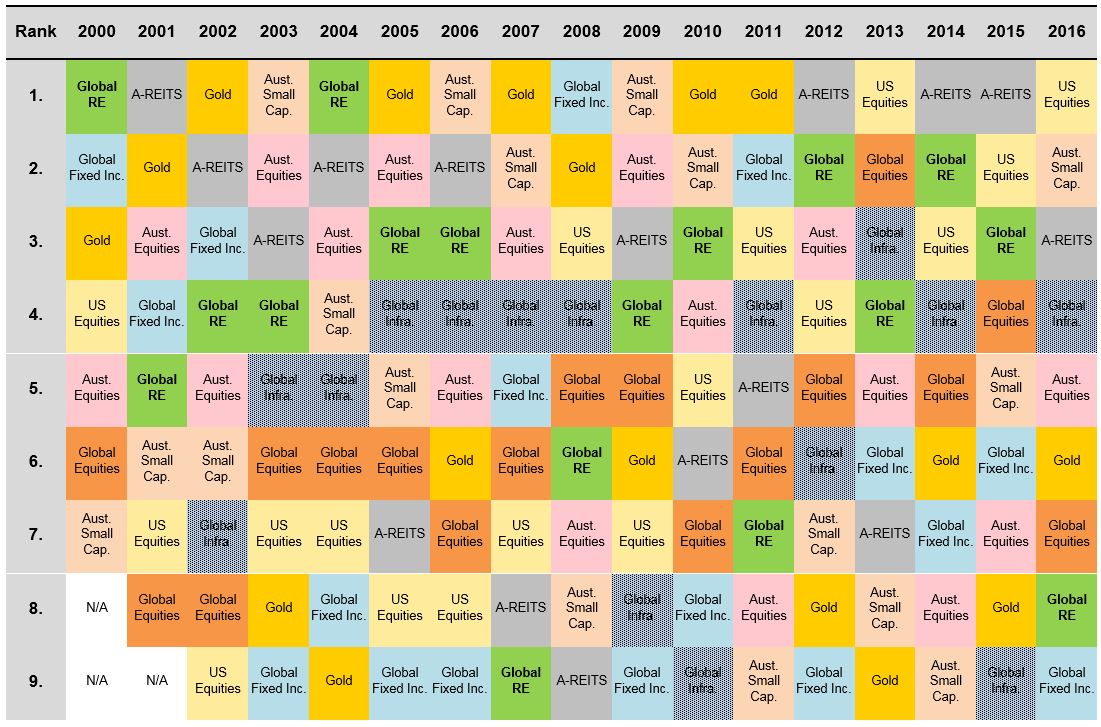
Source: Bloomberg, Quay Global Investors
Based on our sample above, global real estate has been a top four performer on 11 out of 17 occasions. Australian Equities (nine times), US Equities (eight times) and Global Equities (twice) have not been as consistent. Interestingly, whenever global real estate has performed relatively poorly, it has bounced back strongly in the following years.
Conclusion
If we step away from the spreadsheet and think about how interconnected the local economy is, Australian investors who own residential property and Australian equities may not be as diversified as they think. Indeed, in an extreme scenario (where diversification is most valuable), a portfolio of Australian residential property and shares may offer no real diversification at all.
At Quay, we believe there is a case for global real estate allocation in an overall portfolio because:
- unhedged global real estate has delivered annual total returns comfortably above the long-term inflation rate and competing assets;
- its volatility is not significantly different versus other risk assets; and
- for Australian investors, global real estate provides as much diversification as global equities (with a better return track record). It is likely, therefore, to provide much needed diversification even for investors that hold domestic property.
1. Source: ASX / S&P, Bloomberg
2. Source: IMF, https://www.businessinsider.com.au/by-global-standards-australian-banking-has-a-scary-concentration-in-housing-loans-2015-8