

Too much money chasing too few goods
The idea inflation reflected ‘too much money chasing too few goods’ was coined by Milton Friedman, the father of monetarism. It simplified inflation to the idea that money supply growth relative to real supply growth is inflationary. The idea is as seductive as it is simple. The complexity arises when one tries to define ‘money’, how it’s issued, and who are the responsible issuers.
While we recognise the causes of inflation are many and complex, in this paper we zero in on one of the issues that seems to be blamed the most. Money printing.
Refresher: Quantitative Easing is not money printing
After the global financial crisis (2008) most developed economies embarked on a new monetary policy instrument, Quantitative Easing (QE). In simple terms, QE allows the central bank (CB) to acquire high quality assets, usually government bonds, for cash. When first introduced in the US (2009) an open letter from prominent economists and historians to the Fed chair, Ben Bernanke, warned against such policy seeing it as leading to currency debasement and inflation1.
But QE is one policy where there is no money printing. QE is a swap of one asset (bond) for another (cash). No new net financial assets are created with such a policy2. It is analogous to moving one’s savings from a term deposit to an at call account.
It was therefore no real surprise that despite various forms of QE in the US, Japan, and Europe between 2001 and 2020, no developed country met their inflation target due to constant levels of disinflation.
How real money is created
The latest bogeyman blamed for inflation has been government spending. And here the critics have a point. Net government spending (deficits) literally prints money. When governments spend, treasury departments instruct banks to mark-up recipient private bank accounts (deposits). These new liabilities for banks are paid for by the treasury transferring reserves to banks (an asset for the banks). Banks use these reserves to buy bonds. The net result? Banks own bonds, and the bank accounts of the private sector have swelled from government transfers reflecting new money ready to spend3.
The second method of creating money is rarely discussed. Credit creation.
As discussed in part 2 of our Modern Monetary Theory series, private credit growth creates new money. New loans create new deposits and hence new money. For readers who are sceptical of this process, this Bank of England video provides an excellent summary.
Is the creation of new money via private credit growth causing our inflation ills? Let’s dig in.
The data
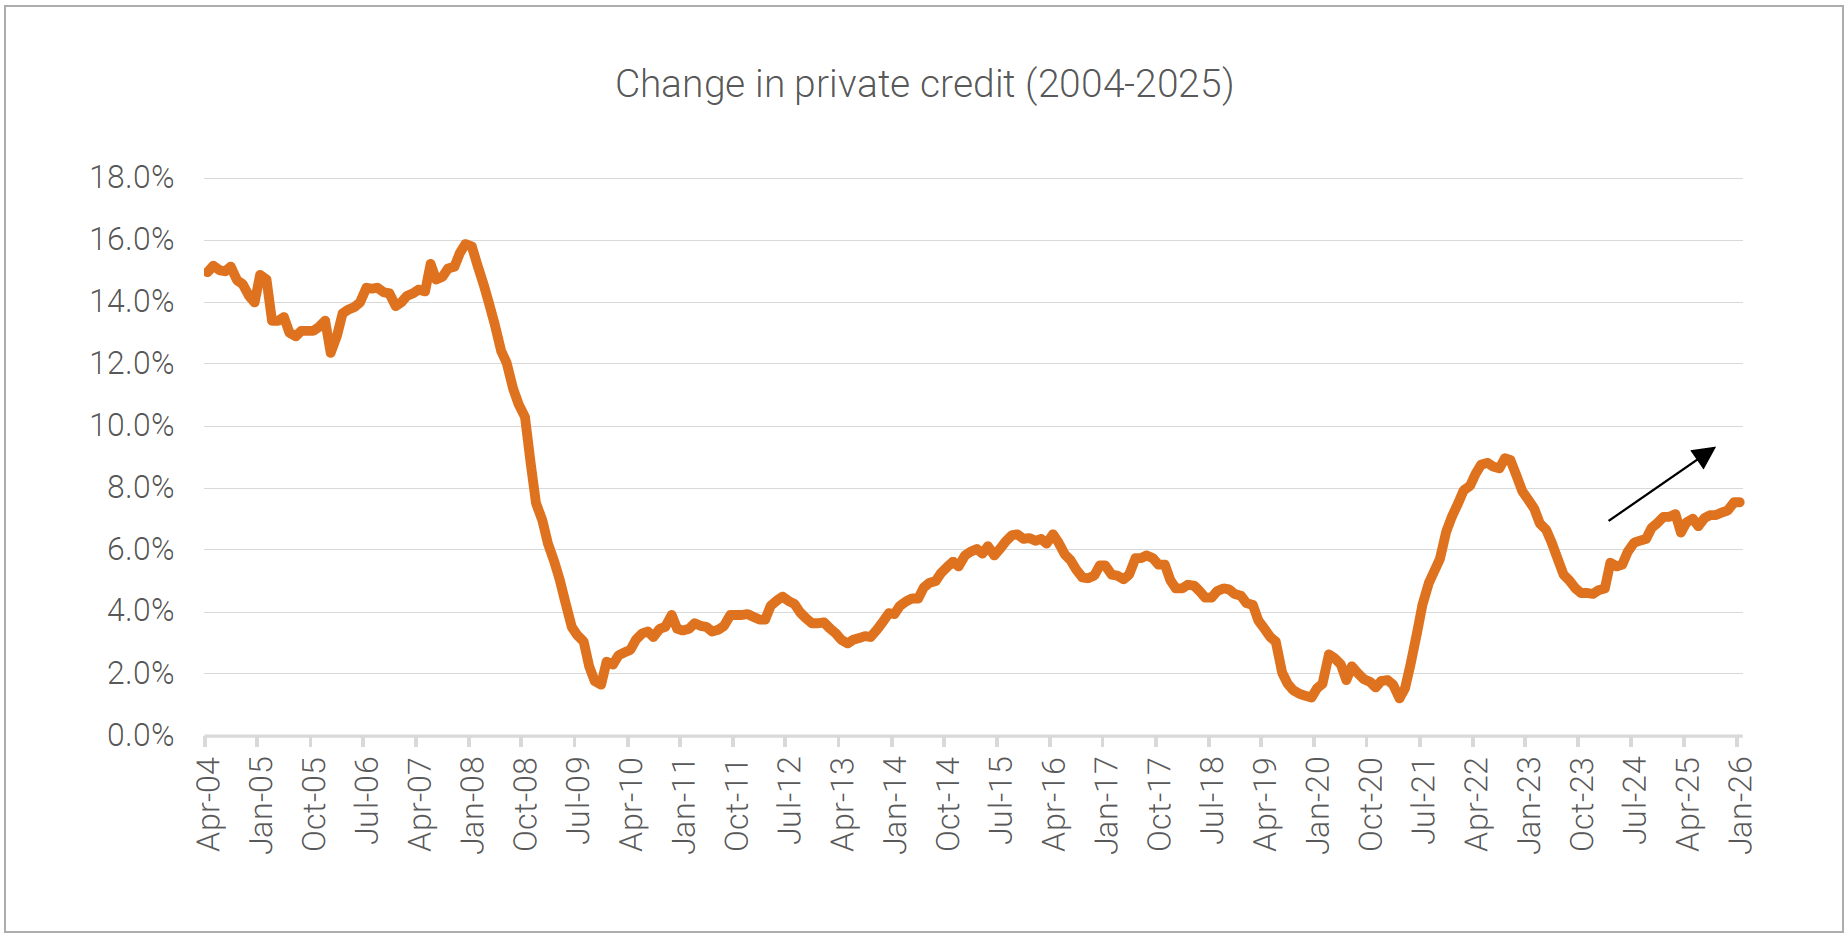
The following chart highlights Australian credit growth since 2004. The recent re-acceleration of growth since 2023 can be clearly identified
 Source: RBA credit aggregates, Quay Global
A closer look at the above chart identifies a few other observations:
- Pre-financial crisis (2008), Australian credit growth was booming. This was despite the fact the RBA was aggressively increasing the cash rate from 4.75% (Oct 2003) to 7.25% (March 2008)4.
- Post financial crisis, credit growth remained relatively subdued and in fact decelerated between 2016 to 2019 despite the RBA reducing the cash rate from 2.0% (April 2016) to 0.75% (October 2019).
- The strong rebound in credit in 2021-2022 (post COVID) coincided with post COVID inflation.
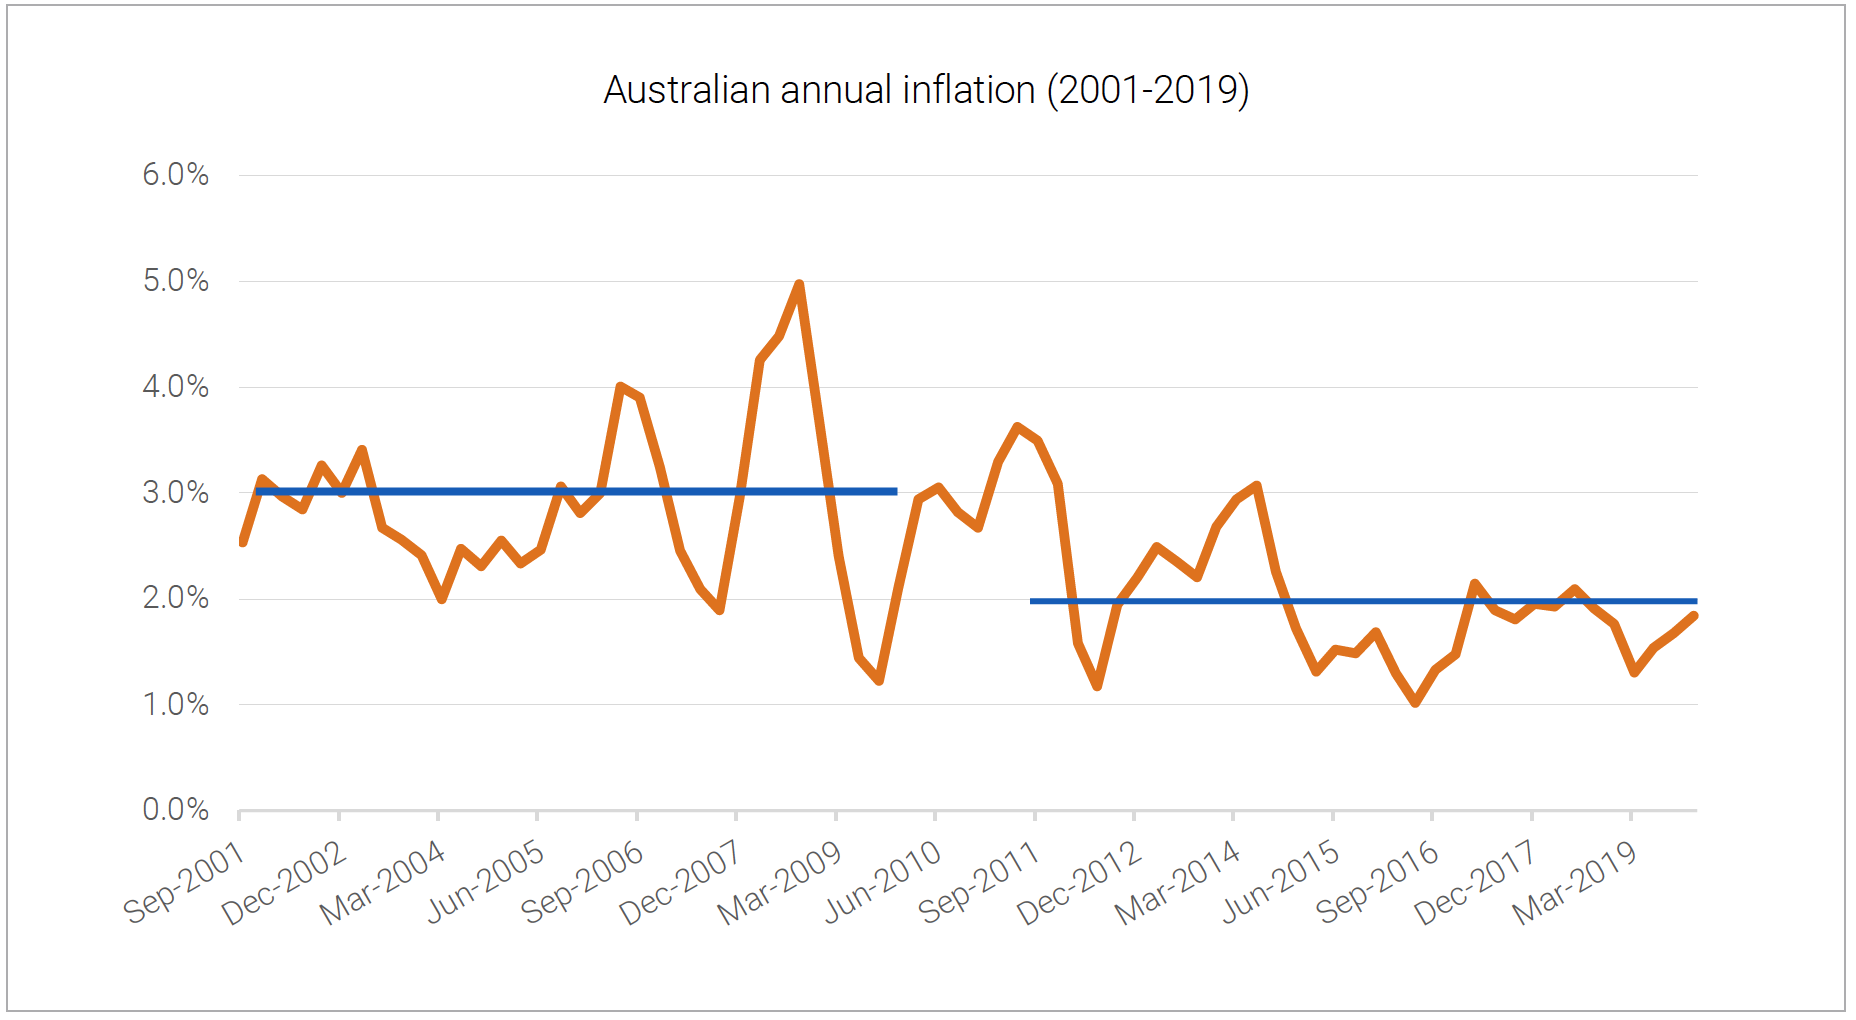
If private credit growth has a role to play in inflation, the above chart would suggest Australia had more of an inflation problem pre-GFC rather than post GFC. And that is exactly what the data supports, as per the following chart.
 Source: ABS, Quay Global
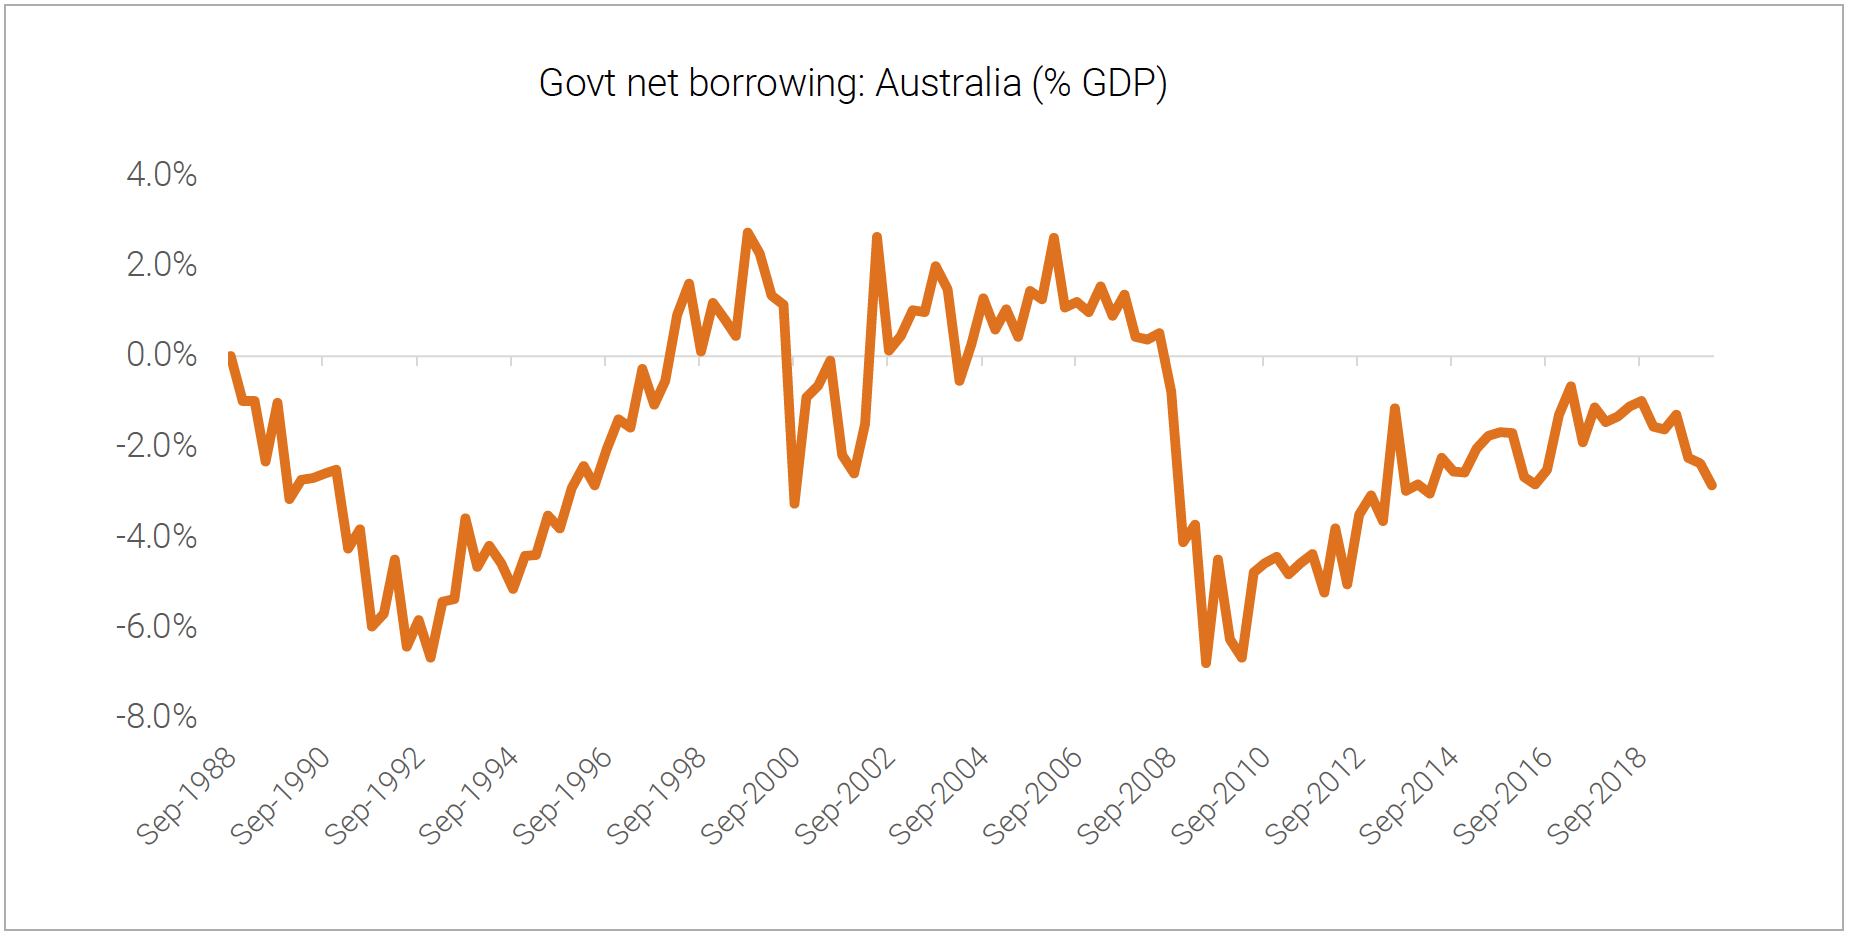
And the relatively high inflation pre-GFC cannot be blamed on government spending. In fact, the opposite was true. Australia ran persistent surpluses in the early 2000’s compared to persistent deficits post GFC.
 Source: ABS, Australian Treasury, Quay Global
We have been here before: The 1980’s
The difference in Australian inflation pre and post GFC is difficult to explain by reference to government spending and interest rate policy alone. Relative credit growth appears to fill in the missing piece.
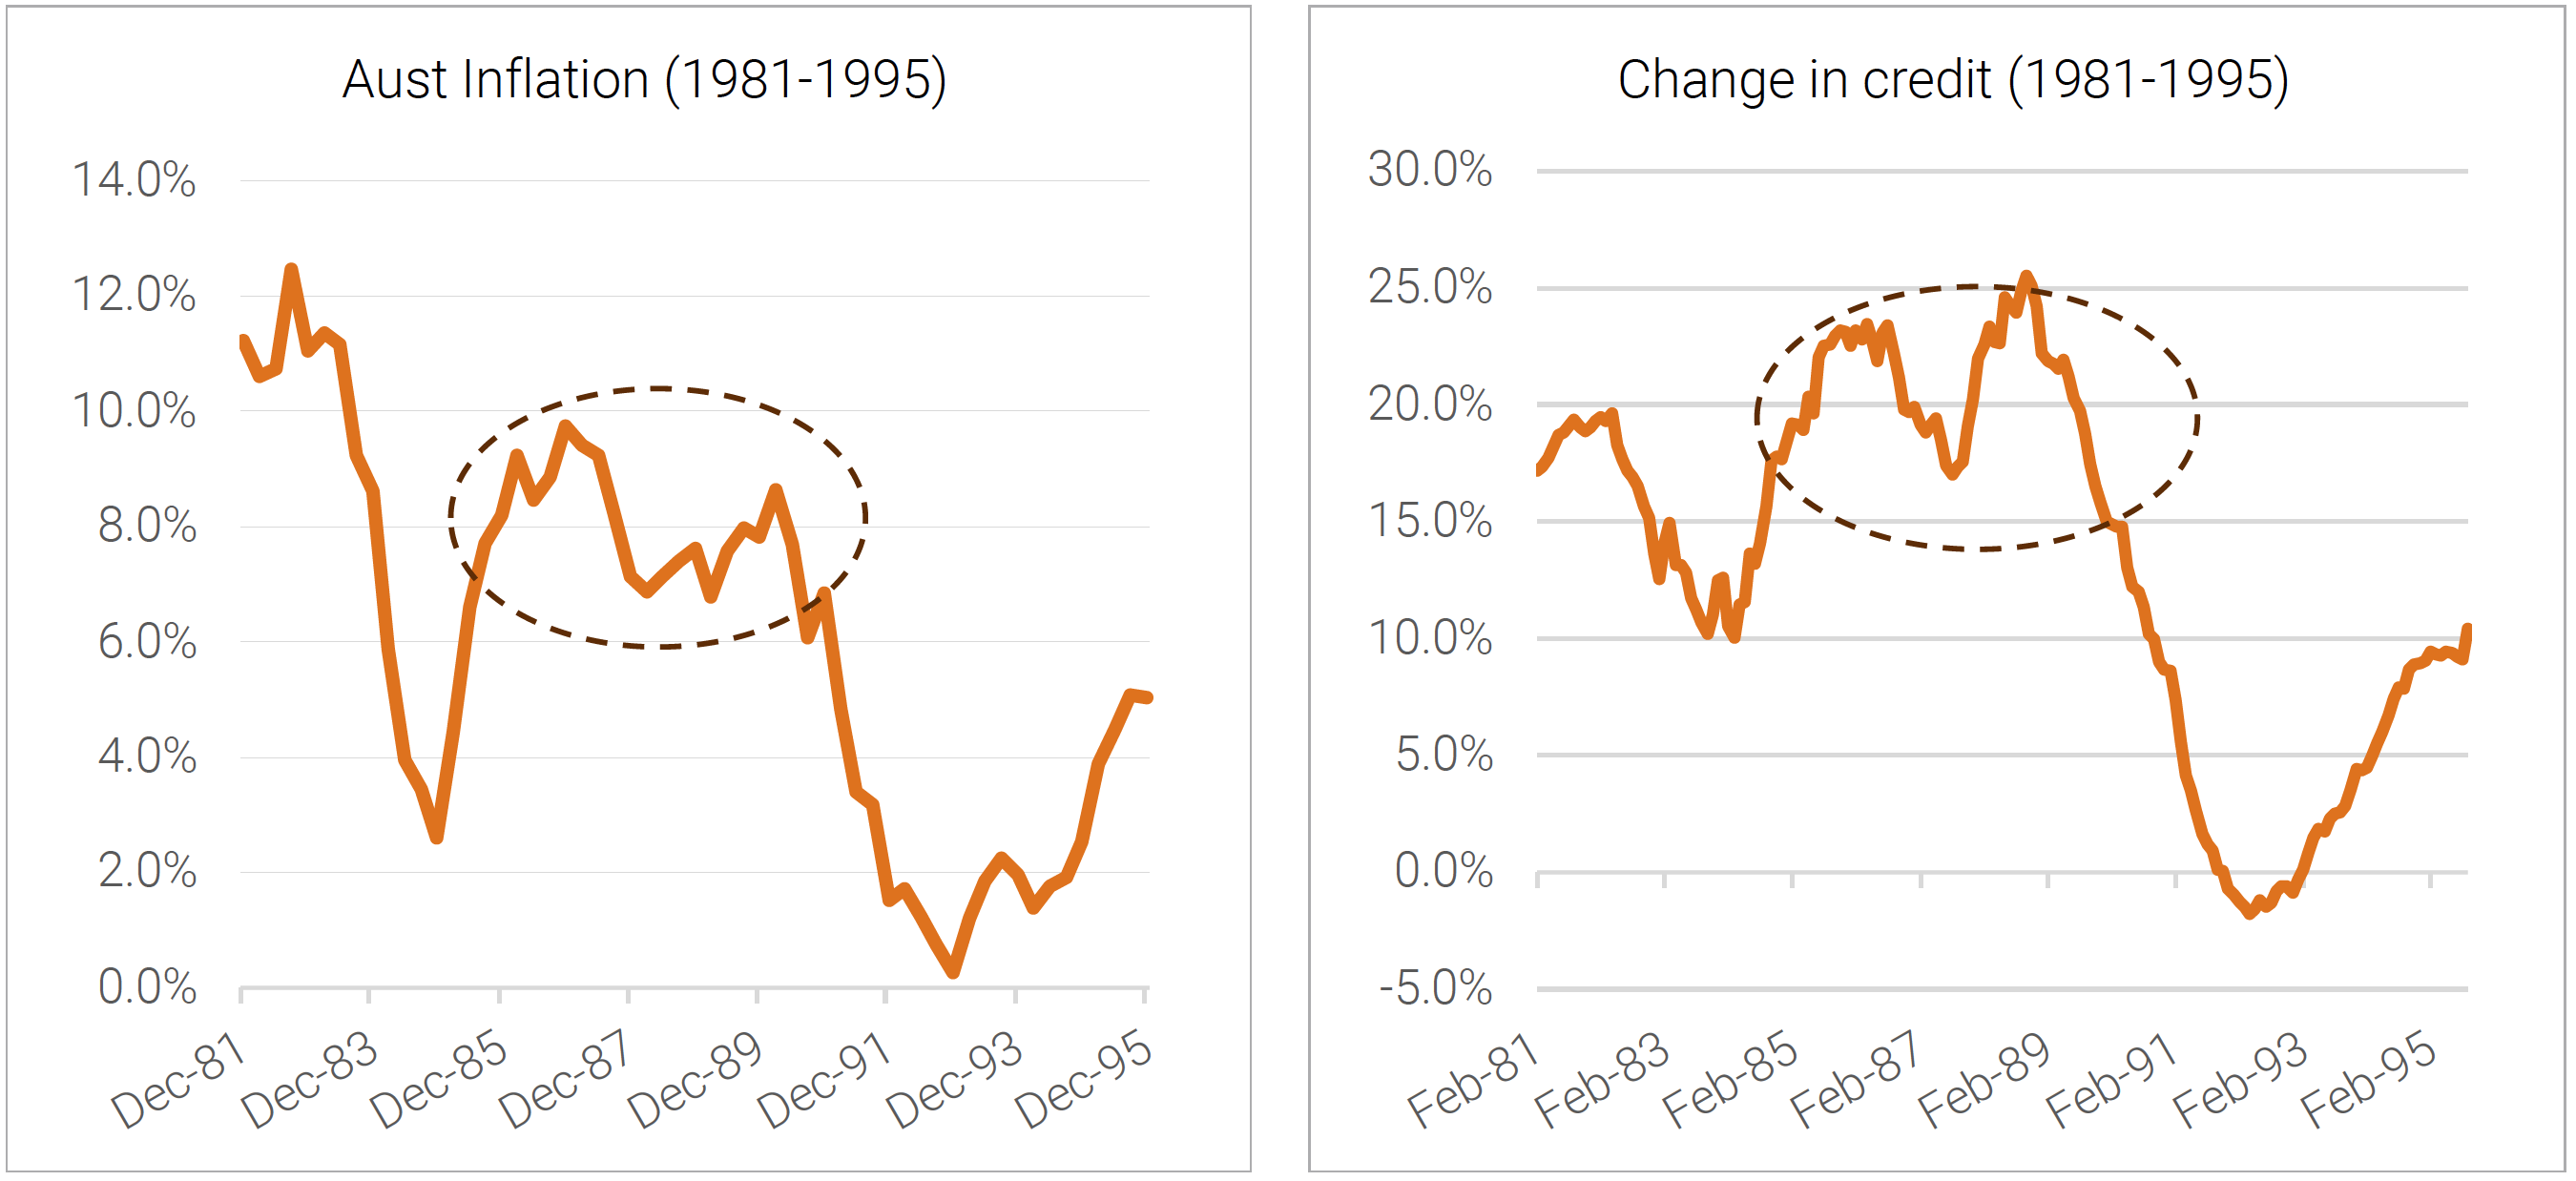
The same was true in the late 1980’s, an era that saw high inflation along with:
- a balanced federal budget (1988-89),
- rising interest rates (peaked at 17.5-18.5% in Jan 1990), and
- very strong private credit growth (~20% per annum).
 Source: RBA, ABS, Quay Global
Higher interest rates may not slow credit growth
Most central banks and market practitioners work on the assumption higher interest rates curb credit appetites and hence acts as a brake on inflation. However, history often suggests otherwise. Strong credit growth in Australia is often associated with rising interest rates (1980’s, early 2000’s). And this is not just an Aussie characteristic:
- The US famously had a credit boom between 2002-2007 as the Fed increased cash rates from 1% in 2004 to 5.25% in 2006.
- The Japanese credit bubble emerged in the 1980’s as the cash rate varied between 3 and 6%.
- Pre GFC, European credit growth averaged 9-10% while the cash rate increased from 2% in 2005 to 4.25% by July 2008.
This is where one could argue central bank models fail. Credit growth is more than just about price – it also reflects risk appetite. And risk appetite can be highly correlated with rising asset values (real estate / stocks) independent of the price of credit.
In addition, non-monetary policy changes can also have an impact. For example, recent housing policies have encouraged higher risk tolerance via the federal government’s 5% home loan deposit scheme which came into effect in October 2025. Is it any wonder residential credit growth has since accelerated from 5.7% in July 2025 to 6.7% by January 20265. There can be no better example of Australia’s broken policy framework where the federal government is working to make home ownership easier, while the RBA is working to make it harder.
Conversely, macroprudential tools, such as limiting credit growth via regulation can be disinflationary even in a low-interest rate environment.
Concluding thoughts
Australian inflation has been sticky post COVID, which has encouraged the RBA to increase interest rates for the second time this year.
However, one source of inflation (private credit growth) is re-accelerating. And history shows that monetary policy alone cannot quell private sector demand for credit.
Worryingly for the RBA, the current environment of rising inflation, rising interest rates and accelerating credit growth has historically ended in a meaningful economic correction; the same conditions that were prevalent in Japan (1989), Australia (1990), and the US (2008) all ended in vicious recessions.
Forced by its narrow policy toolkit, the RBA may need to keep raising interest rates until the private sector ‘cracks’ or until some other exogenous event derails Australia’s economic fortunes causing the private sector to meaningfully reassess its appetite for risk.
The content contained in this article represents the opinions of the authors. The authors may hold either long or short positions in securities of various companies discussed in the article. The commentary in this article in no way constitutes a solicitation of business or investment advice. It is intended solely as an avenue for the authors to express their personal views on investing and for the entertainment of the reader.
[1] https://www.hoover.org/research/open-letter-ben-bernanke
[2] For more on the mechanics of QE, please refer to our 2019 paper QE is coming but will probably do nothing
[3] For more on the mechanical process of government spending refer to our paper MMT and why you're going to hear a lot more about it
[4] Source: RBA https://www.rba.gov.au/statistics/cash-rate/
[5] Source: RBA Credit aggregates