

Price to NAV – the key to REIT investing?
Price to net asset value is a common valuation metric for REITs and real estate investing. In this article, we consider net asset value (NAV) as a valuation guide, and explore whether it’s a good predictor of REIT returns.
What is NAV?
A REIT’s NAV is the estimated direct property market value of its total assets minus the value of total liabilities. NAV can be expressed on a per share basis and compared to the stock price, which gives the ratio, price/NAV. When this ratio is above 1, the stock is at a premium to NAV, and when below 1, a discount to NAV.
Effectively, it’s used to measure the relative value of the REIT’s real estate priced in the public market relative to similar assets in the private market.
Price > NAV = sell?
Investors and analysts, particularly those that are sector agnostic, may shy away from REITs on the basis that the sector is trading at a price premium to its NAV. After all, why buy real estate above what it’s worth in the private market?
But just how effective would this approach have been historically? Can discounts and premiums to NAV provide a roadmap for future returns?
To test this, we compared annual prices / discounts to NAV with one-year ahead returns for the US REIT sector. For the analysis, we utilise data pertaining to the US REIT sector which makes up the majority (roughly two thirds) of the global REIT Index. The data was sourced from real estate specialists, Green Street Advisors.
The x-axis below represents the sector’s premium or discount to NAV, while the y-axis represents the following 12-month return ('next year return’). For price / NAV to have predictive qualities, we would want to see a ‘line of best fit’ sloping downward from left to right (discount to NAV resulting in positive returns the following year).
Clearly such a relationship does not exist; but there is even more we can derive from this data.
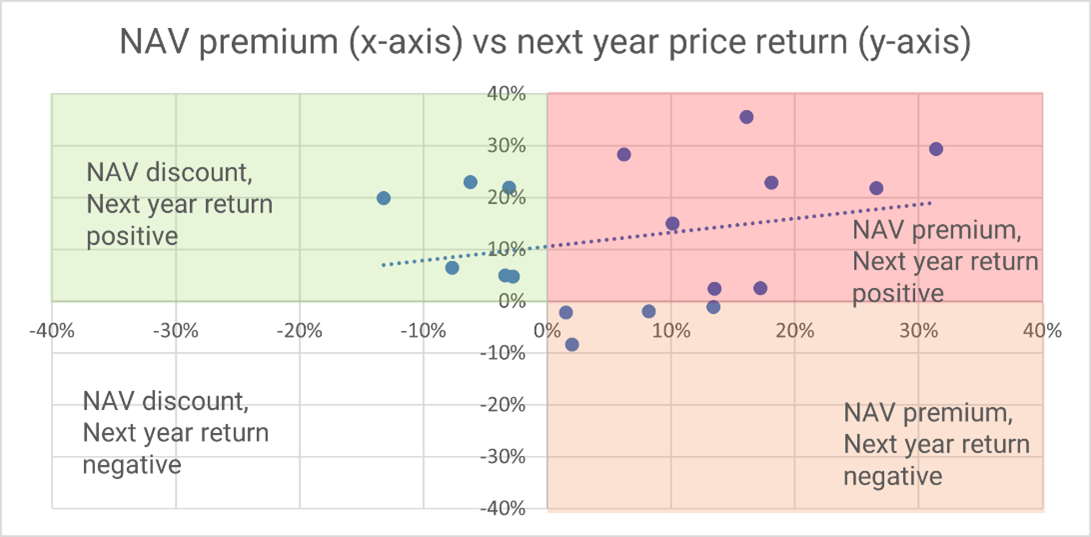
Source: Quay Global Investors, Green Street Advisors
When the sector is trading at a discount to NAV, on six out of six occasions, it had a positive return the following year (see green quadrant above). This is quite a meaningful outcome.
However, when the sector was trading at a premium to NAV, the sector had a negative return the following year on only four of these occasions (see orange quadrant above). In fact, more often than not (eight occasions), the following year’s returns were positive despite the NAV premium. And on five occasions, the following year returns were in excess of 20%.
Only buying into the sector when it’s at a discount or avoiding the sector when it’s at a premium means investors would have foregone an additional eight years of positive returns (see red quadrant).
On this basis, price to NAV valuation doesn’t look like a good predictor of returns.
Earnings or price/NAV?
Now what would happen if we undertook the same analysis, but substituted next year earnings (actual) instead of price/NAV? This time we’re hoping to see a line of best fit sloping upward and to the right – that is, positive earnings growth followed by positive total returns.
Using the same period as our previous chart, we observe next year returns were positive on 12 of the 15 occasions and next year earnings were positive. Interestingly, the three occasions where next year earnings were positive but next year sector returns were negative were in 2012, 2016 and 2017. This coincides with the Taper Tantrum in 2013 and when the Fed lifted interest rates in 2017 and 2018 (T+1 basis).
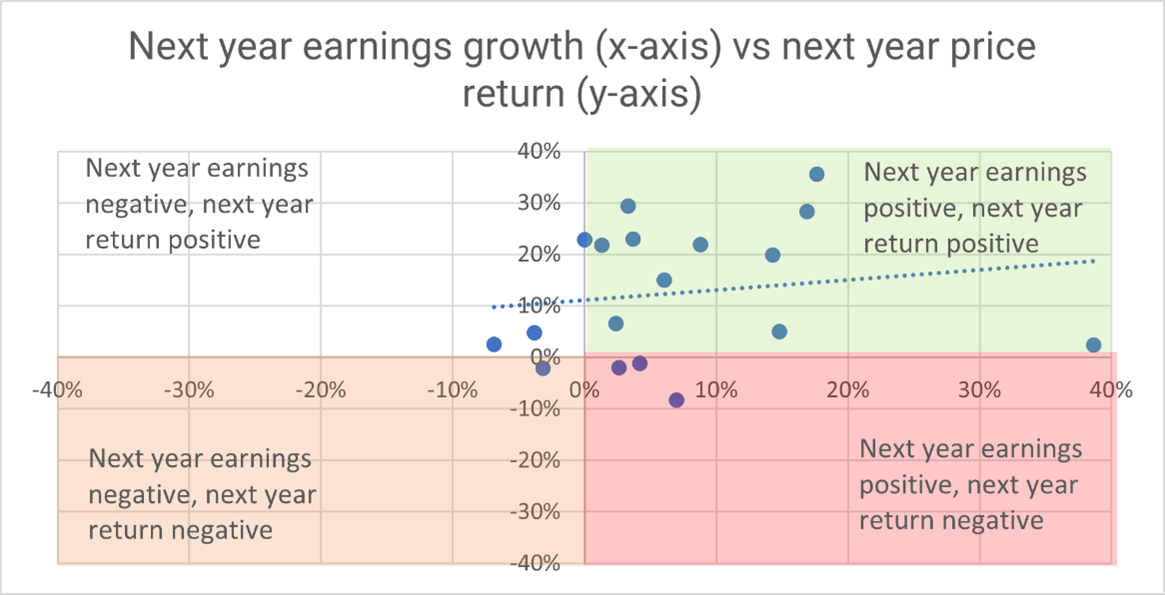
Source: Quay Global Investors, Green Street Advisors, NAREIT T-Tracker, Earnings growth is YoY change in FFOps.
Just like equities, it’s earnings (either actual or forecast) that drive REIT share price returns.
Using NAV for investment decisions
It’s not all bad news for those that focus on NAV. When we break down the data into sectors, we find some correlations very high, while some are quite low.
The following scatterplots compare at price / NAV to one-year forward returns for six US real estate subsectors: office, retail, industrial, self-storage, lodging, and apartments. For price / NAV to have good predictive value, we need to see a downward ‘to-the-right’ sloping relationship.
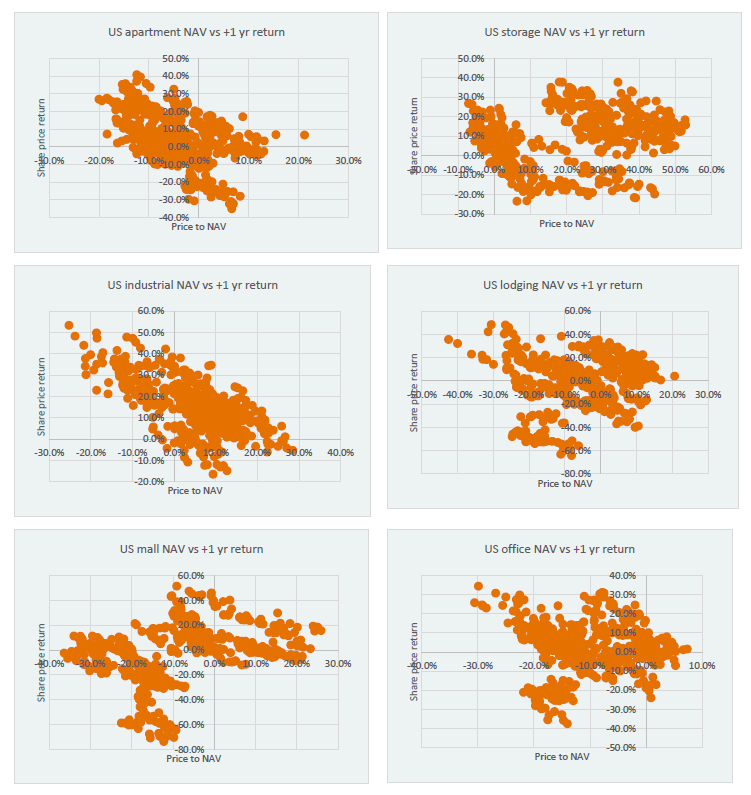
Source: Quay Global Investors, Green Street Advisors
The negative relationship between price / NAV and performance is encouraging for industrial and apartments. Interestingly, the scatterplots are ‘messier’ for other sectors.
Taking this analysis one step further, can running a portfolio based on just ‘price to NAV’ be effective?
To test this, we used the data from the above sectors and ran a simple rules-based portfolio. The portfolio ran an investment strategy where it would simply own the three sectors that were the ‘cheapest’ on a price / NAV basis and avoid the three most expensive sectors. The portfolio was re-balanced when there was a change in the three cheapest sectors. We compared this rules-based portfolio to a portfolio owning all six sectors.
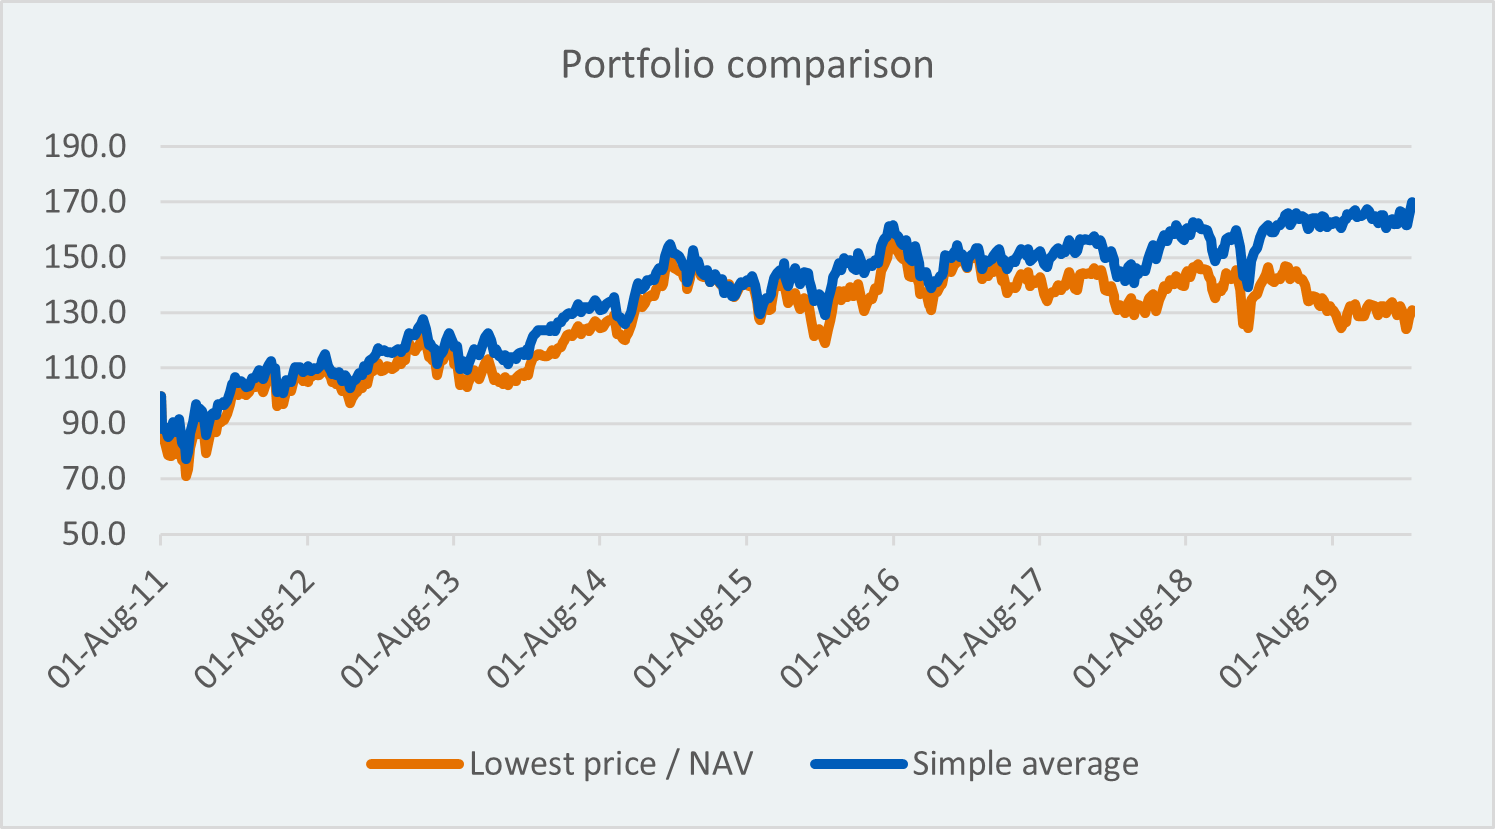
Source: Quay Global Investors
The above chart shows the two portfolios track each other closely for several years, implying the rules-based portfolio had no advantage compared to a sector-wide approach. However, in the last two to three years, the NAV portfolio began to underperform. After eight years, it had underperformed significantly.
Concluding thoughts
While a discount to NAV may be a tempting and relatively easy valuation parameter, the data and analysis we conducted highlights that the approach can be hit-and-miss.
From an overall sector valuation perspective, buying the sector at a discount to NAV leads to positive returns; however ignoring the sector when at a premium can result in significant opportunity cost. We believe there are several explanations for this:
- NAV relies on the assumptions and return objectives of third-party investors or valuers.
- Cap rates based on direct transactions and associated quality adjustments are more of an art than a science.
- Direct property investors can be just as irrational as listed investors.
- NAV investing can encourage pro-cyclical investment decisions. Higher prices (lower cap rates) feed back into analyst models and expectations of higher NAVs. The result is higher cyclical highs and lower lows as the cycle unwinds.
- NAV is a backward-looking indicator. Share markets are priced on a look-forward basis.
- NAV does not consider pay-out ratio, plough back/marginal return on capital, or other company-specific factors such a liquidity, leverage or management competence.
- Not all assets are the same. Some franchise/irreplaceable assets are difficult to value.
At a sector level, the price to NAV approach provides mixed results. And when using this metric for portfolio-based investment decisions, the outcome is worse than simply employing an all-sectors strategy.
At Quay, we fundamentally believe buying a good business at a sensible price generates sustainable attractive long-term total returns. These ‘good businesses’ grow their earnings and cashflows over time which, as our analysis shows, ultimately drives investment performance. We further believe the value discipline is to focus more on discount to replacement cost (where appropriate) rather than discount to NAV.
The content contained in this article represents the opinions of the authors. The authors may hold either long or short positions in securities of various companies discussed in the article. This commentary in no way constitutes a solicitation of business or investment advice. It is intended solely as an avenue for the authors to express their personal views on investing and for the entertainment of the reader.