

These ten charts highlight the key themes we're watching - where growth is slowing, where risks are rising, and why valuations and fundamentals still matter in today’s market.
1. Is e-commerce even a growth industry anymore? (Part 1)
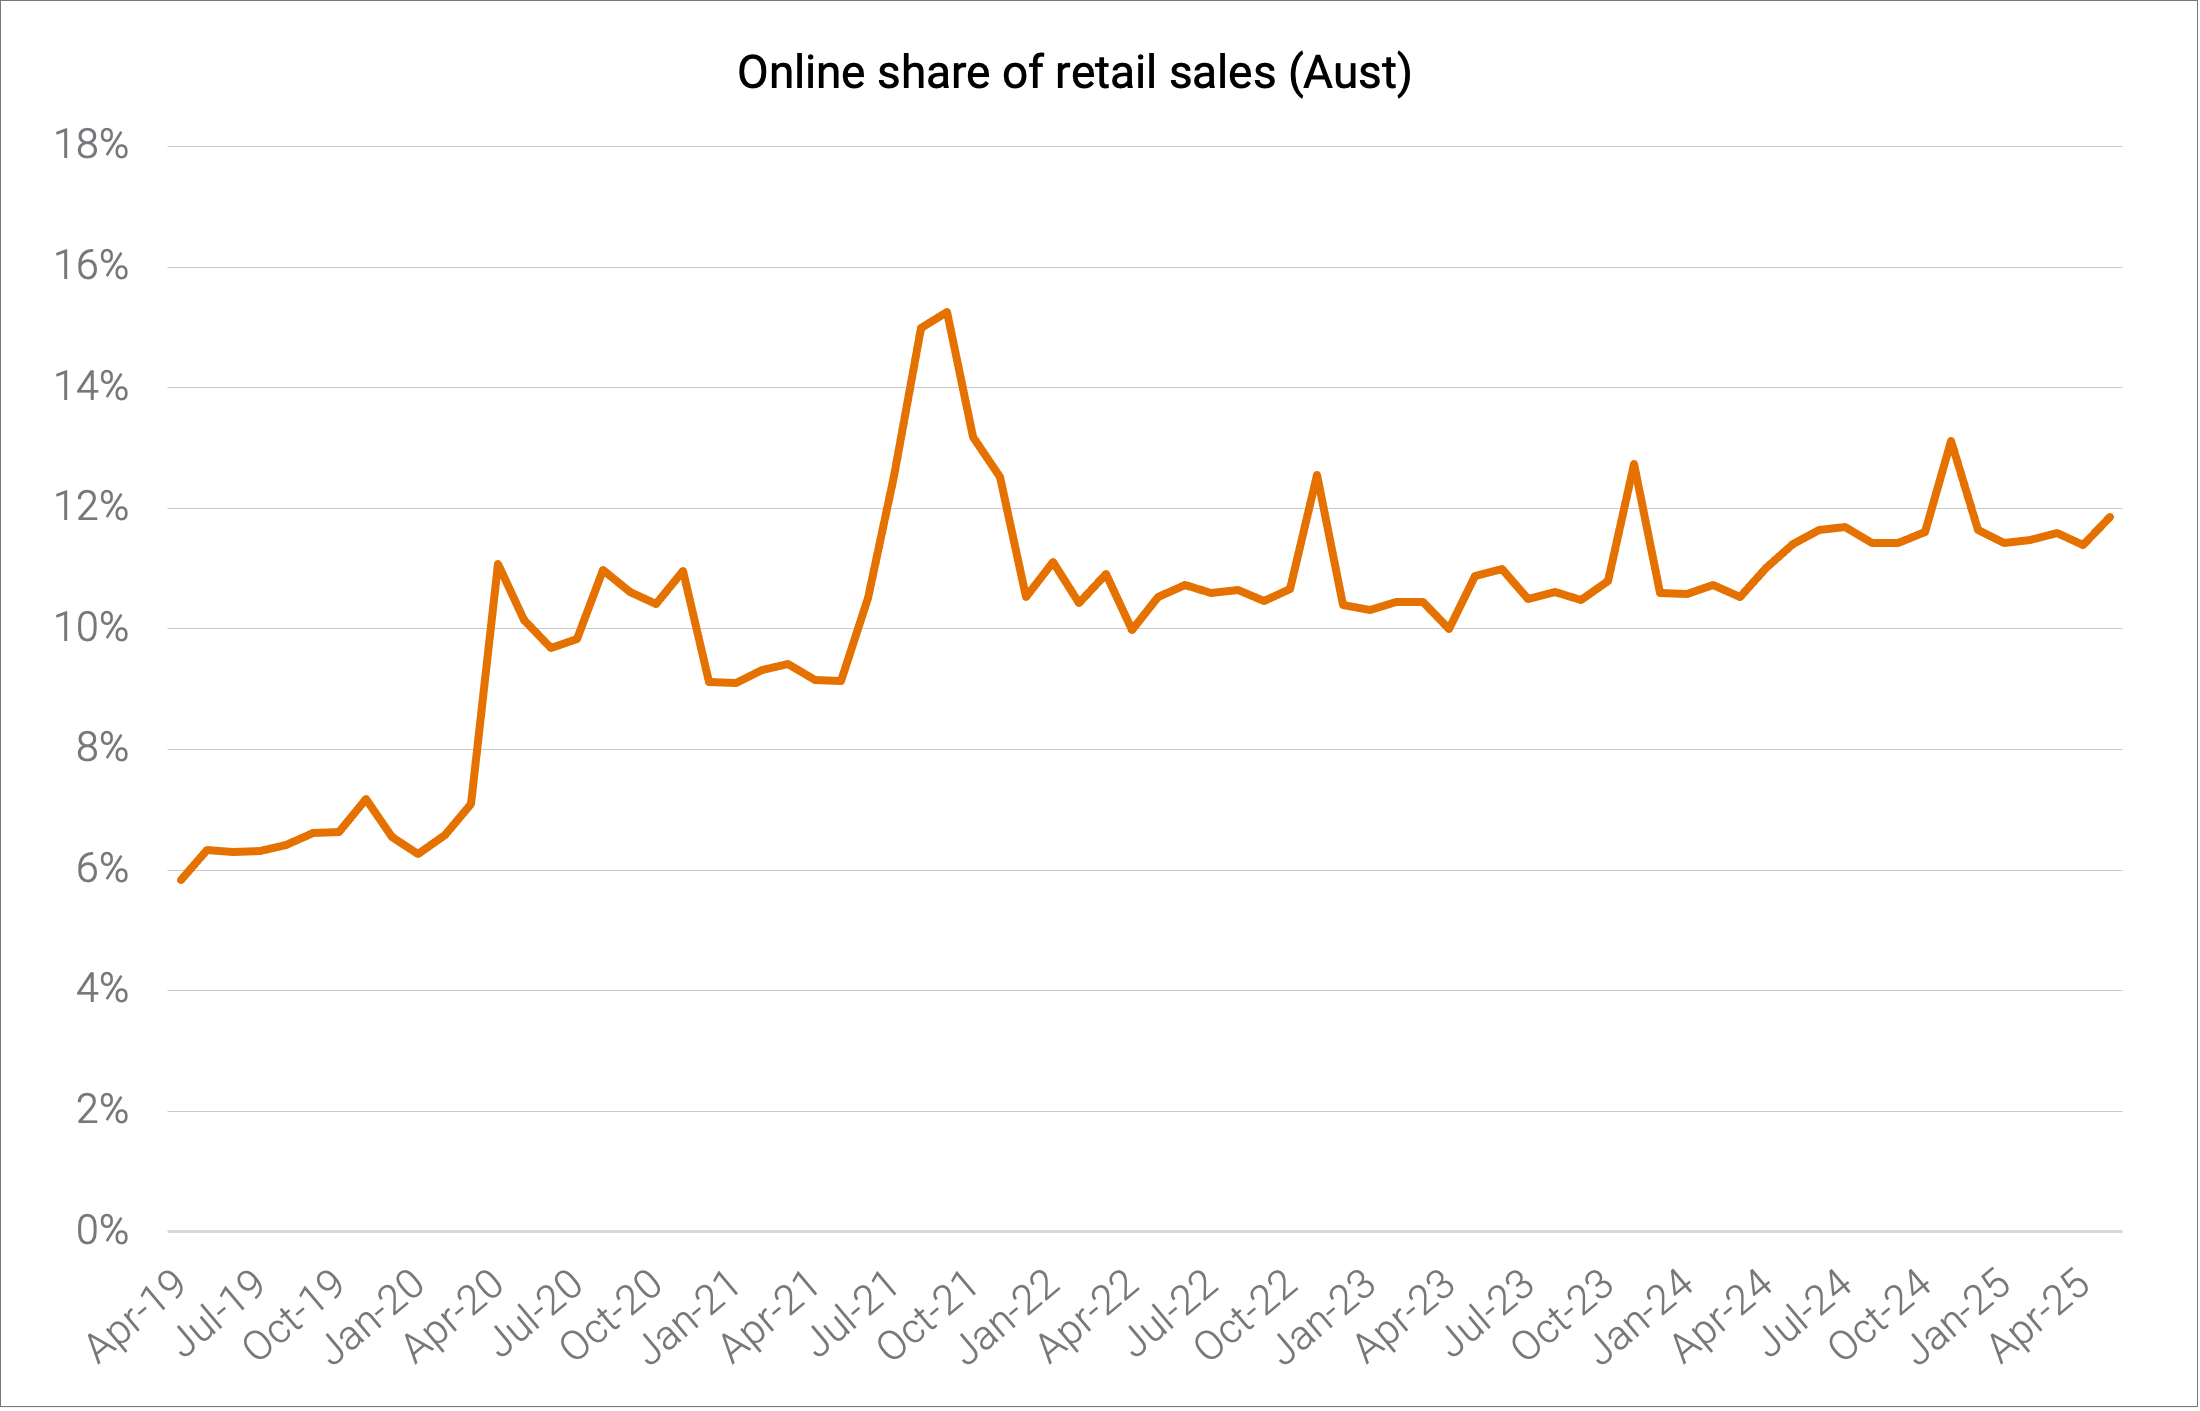 Source: ABS, Quay Global.
What it means
During and in the aftermath of the COVID lockdowns it seemed e-commerce would devour the world - especially physical retail. Four years later a new trend has emerged. Online penetration appears to be peaking in Australia at or around 12% of total retail sales. What was once a ‘secular growth industry’ could now be morphing into a traditional cyclical industry.
We believe this will continue to be a headwind for the Industrial assets class that benefited from ‘over leasing’ and ‘over developing’ in the years post-COVID.
2. Is e-commerce even a growth industry anymore? (Part 2)
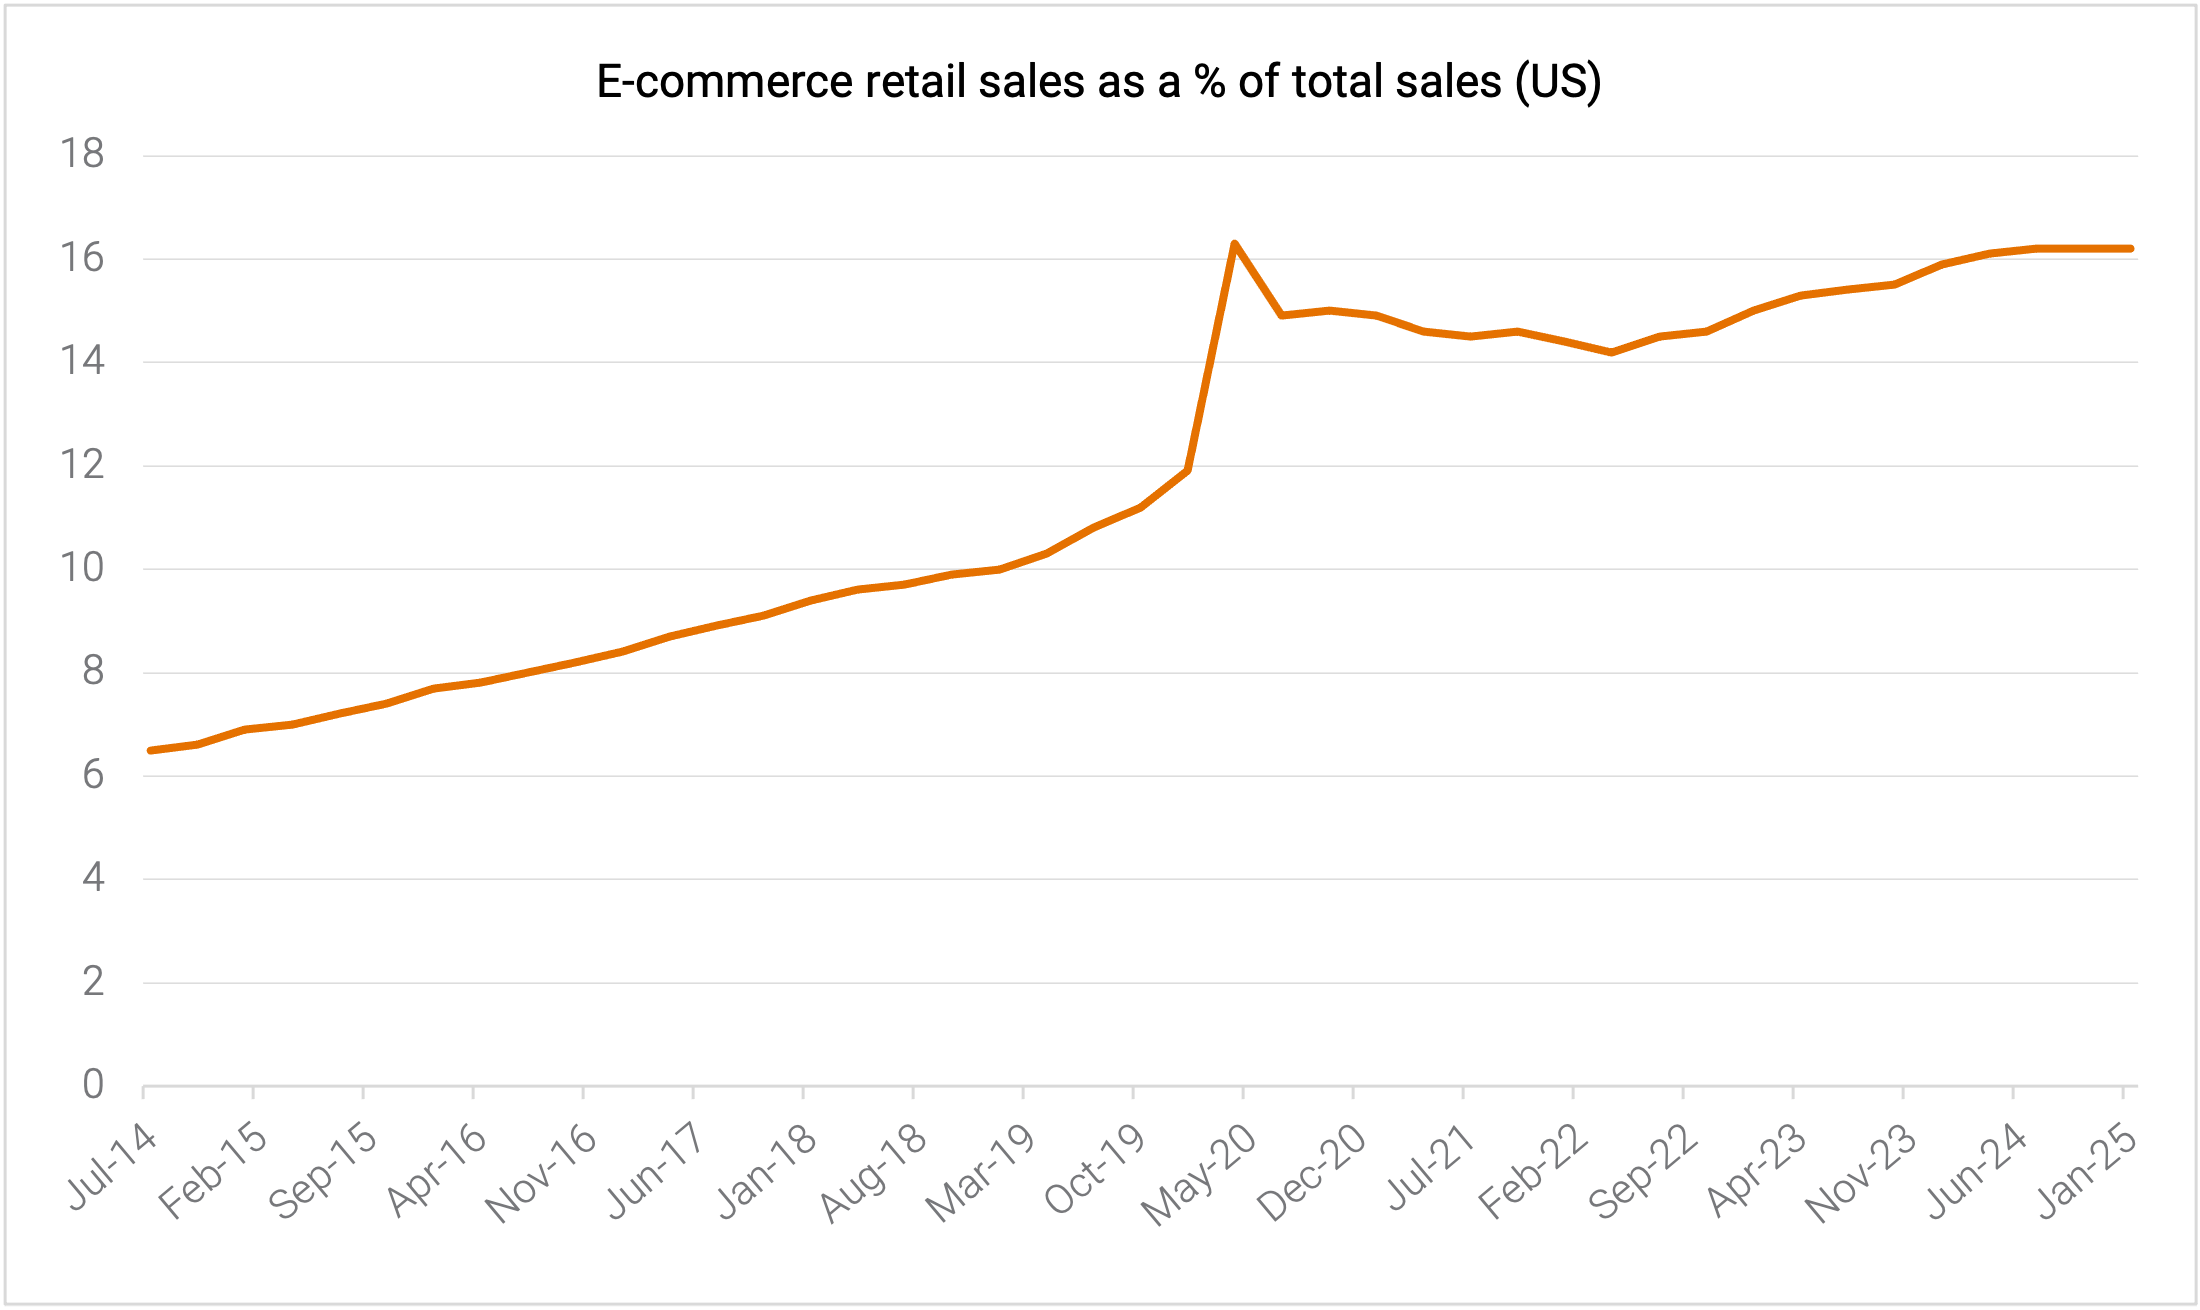 Source: US Census Bureau, Quay Global.
What it means
And it’s not just in Australia. In the US, e-commerce’s share of retail sales peaked at 16.3% in April 2020 and appears to be plateauing at this level today. The implications are profound for real estate, and are two-fold:
- Investors expecting reacceleration of industrial development and underlying demand in the future may be somewhat disappointed.
- The fear and risk relating to physical retail (shopping centres) is likely to continue to abate, leading to future investor confidence in both the direct and listed markets, as peak e-commerce share becomes more certain. The lack of any new recent supply of retail space should increase leasing tension as tenants look to stores as a new avenue for growth.
We are already seeing some evidence of this with the transaction market beginning to thaw – both in the US and in Australia, where Scentre Group recently announced a 25% sale of Chermside Shopping Centre - the first sale for the group since 2019.
3. And the largest e-commerce tenant does not appear in growth mode
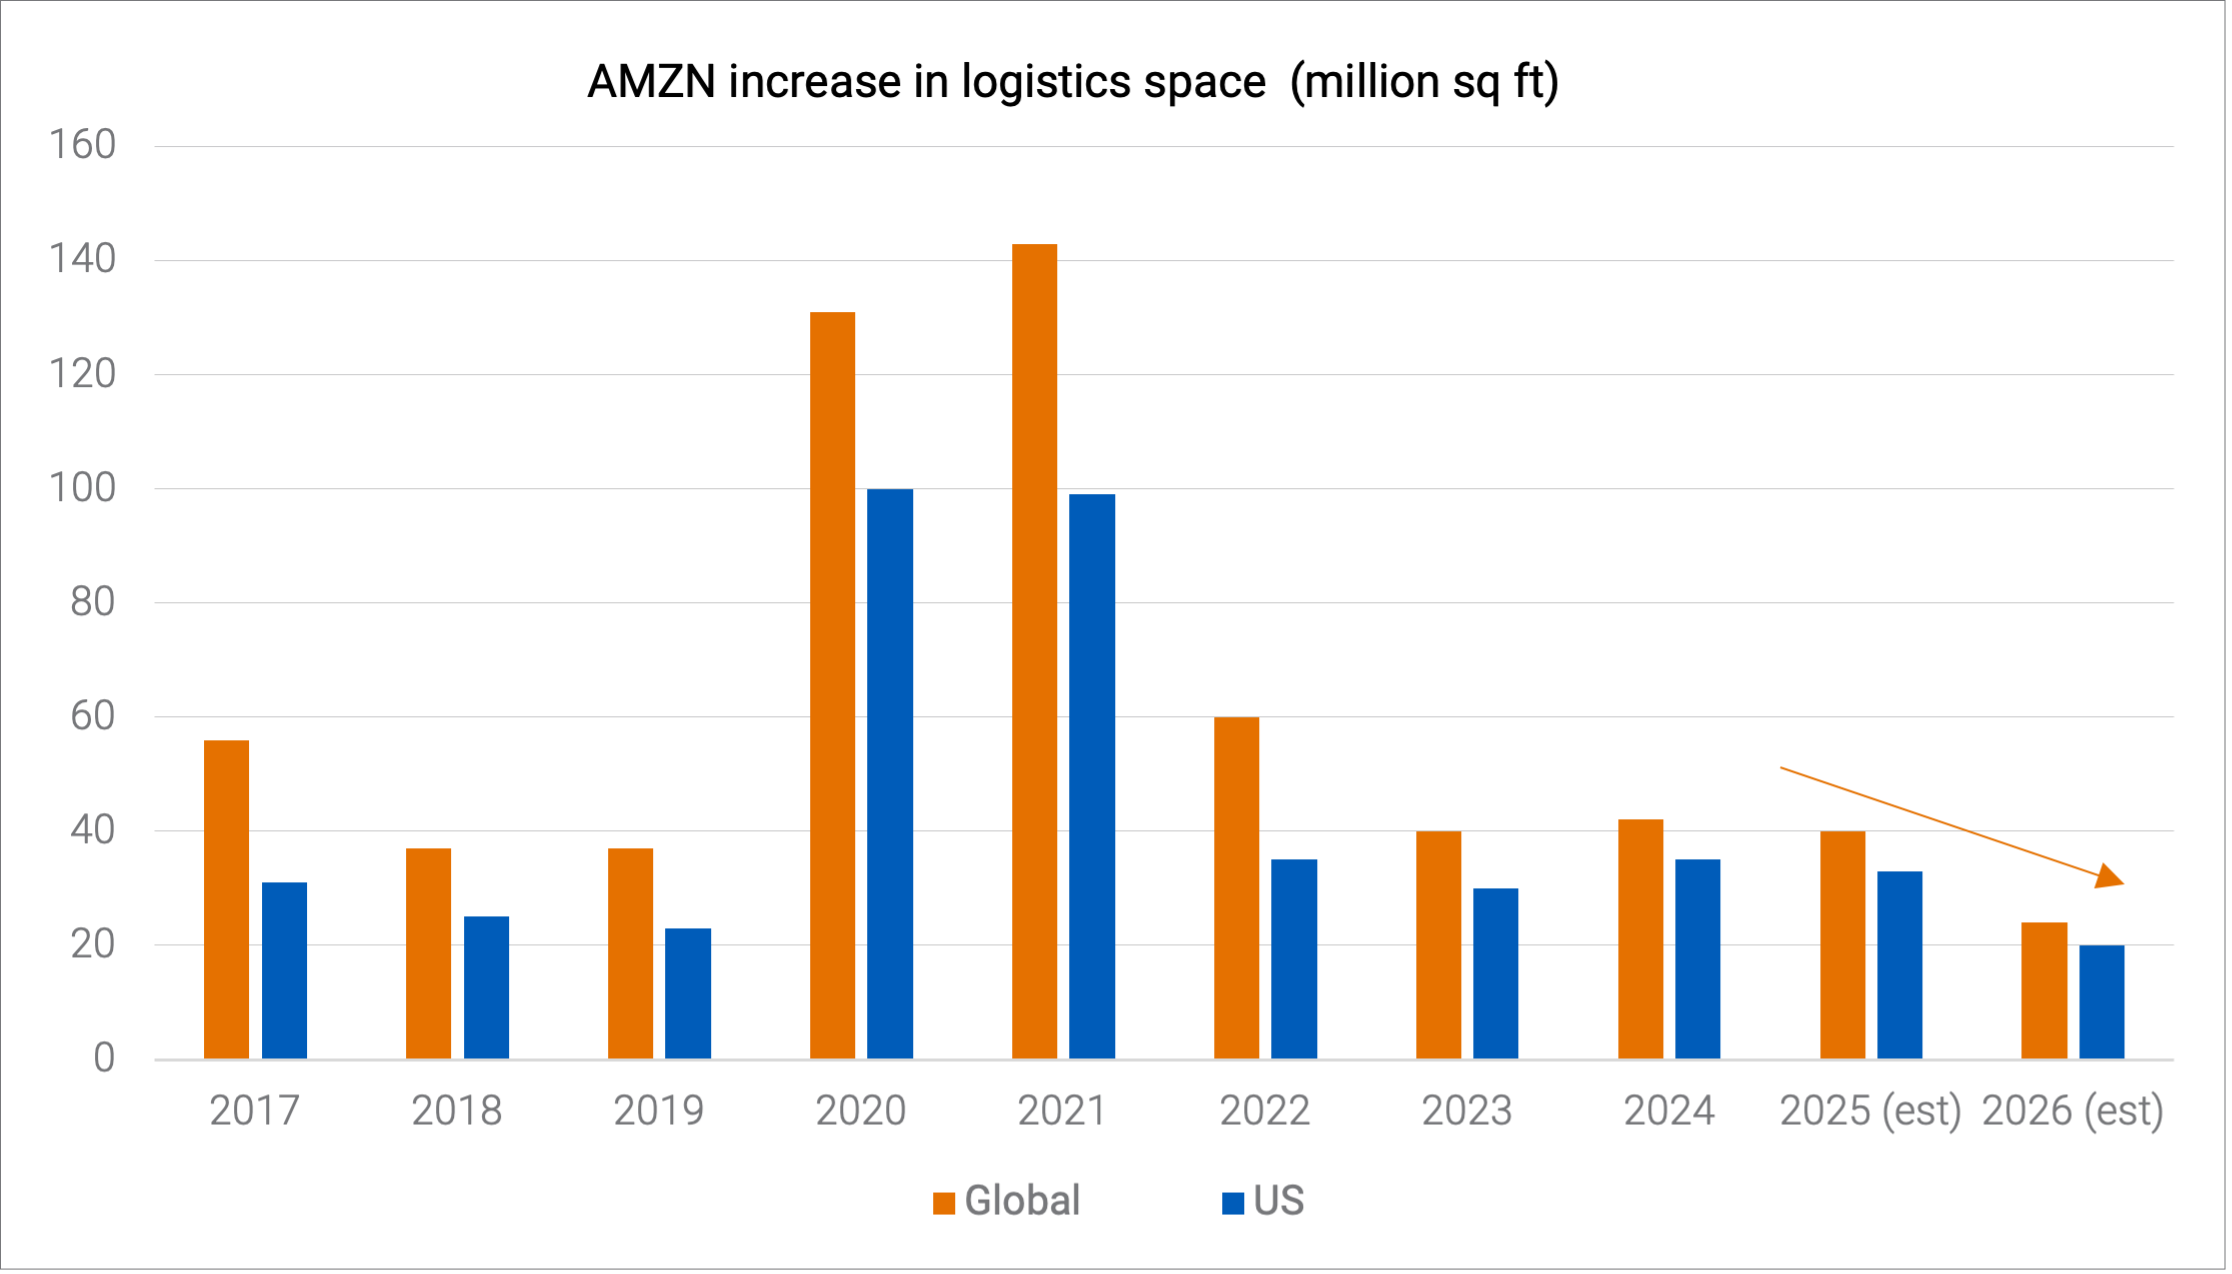 Source: BMO capital markets, MWPVL.
What it means
One could be forgiven for thinking the drop in Amazon’s leasing volume post-COVID reflected over-leasing in 2020 and 2021. However, as this chart highlights, demand for additional warehouse space is projected to again decline in 2026, suggesting this is more than just a whipsaw adjustment. It may reflect broader recognition that e-commerce share (as per the previous charts) is peaking.
What is even more problematic for the industrial landlords is that:
- unlike previous years, Amazon’s future warehouse needs will be almost entirely self-built, with minimal third-party leasing, and
- Amazon continues to take market share from other e-commerce and third-part logistics providers – suggesting there will be no positive offset from other sectors in terms of new leasing demand.
4. Australian bankruptcies are rising … fast
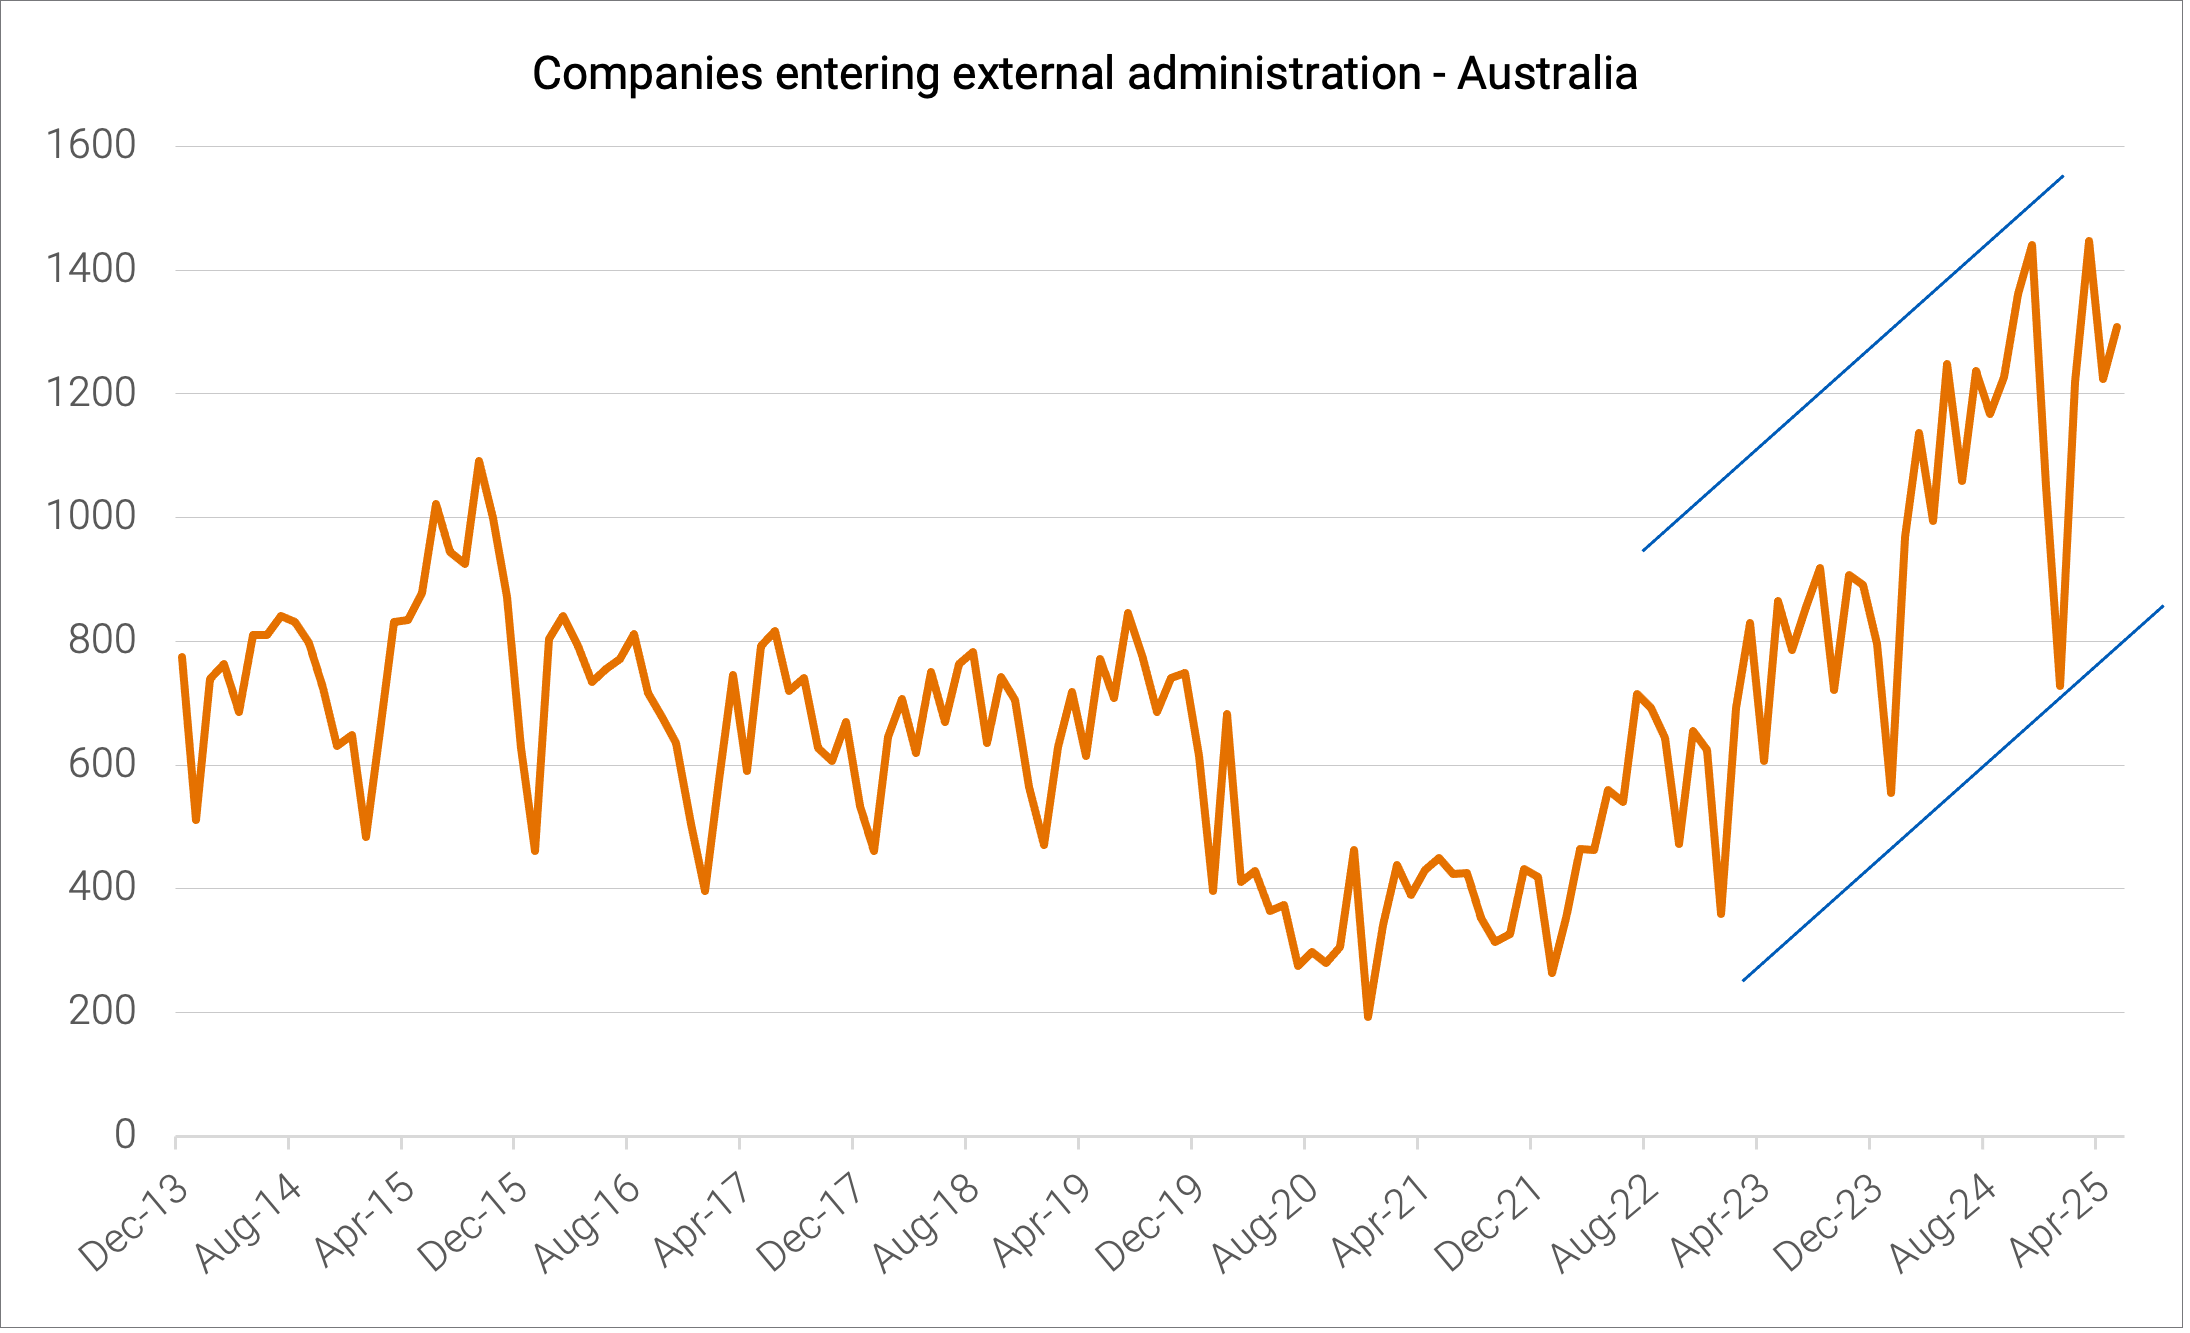 Source: ASIC, Quay Global.
What it means
Last month, the RBA disappointed the market by holding interest rates steady. Since then, there have been signs the labour market is beginning to soften, with a moderate increase in the unemployment rate to 4.3%.
However, there is additional data that points to weakness in the private sector. Most notably, a continued rise in bankruptcies.
After reaching a low during COVID, Australian companies entering external administration has continued to rise – with few signs of slowing.
In recent quarters, government demand has provided an offset to private sector weakness. The question is: will that continue?
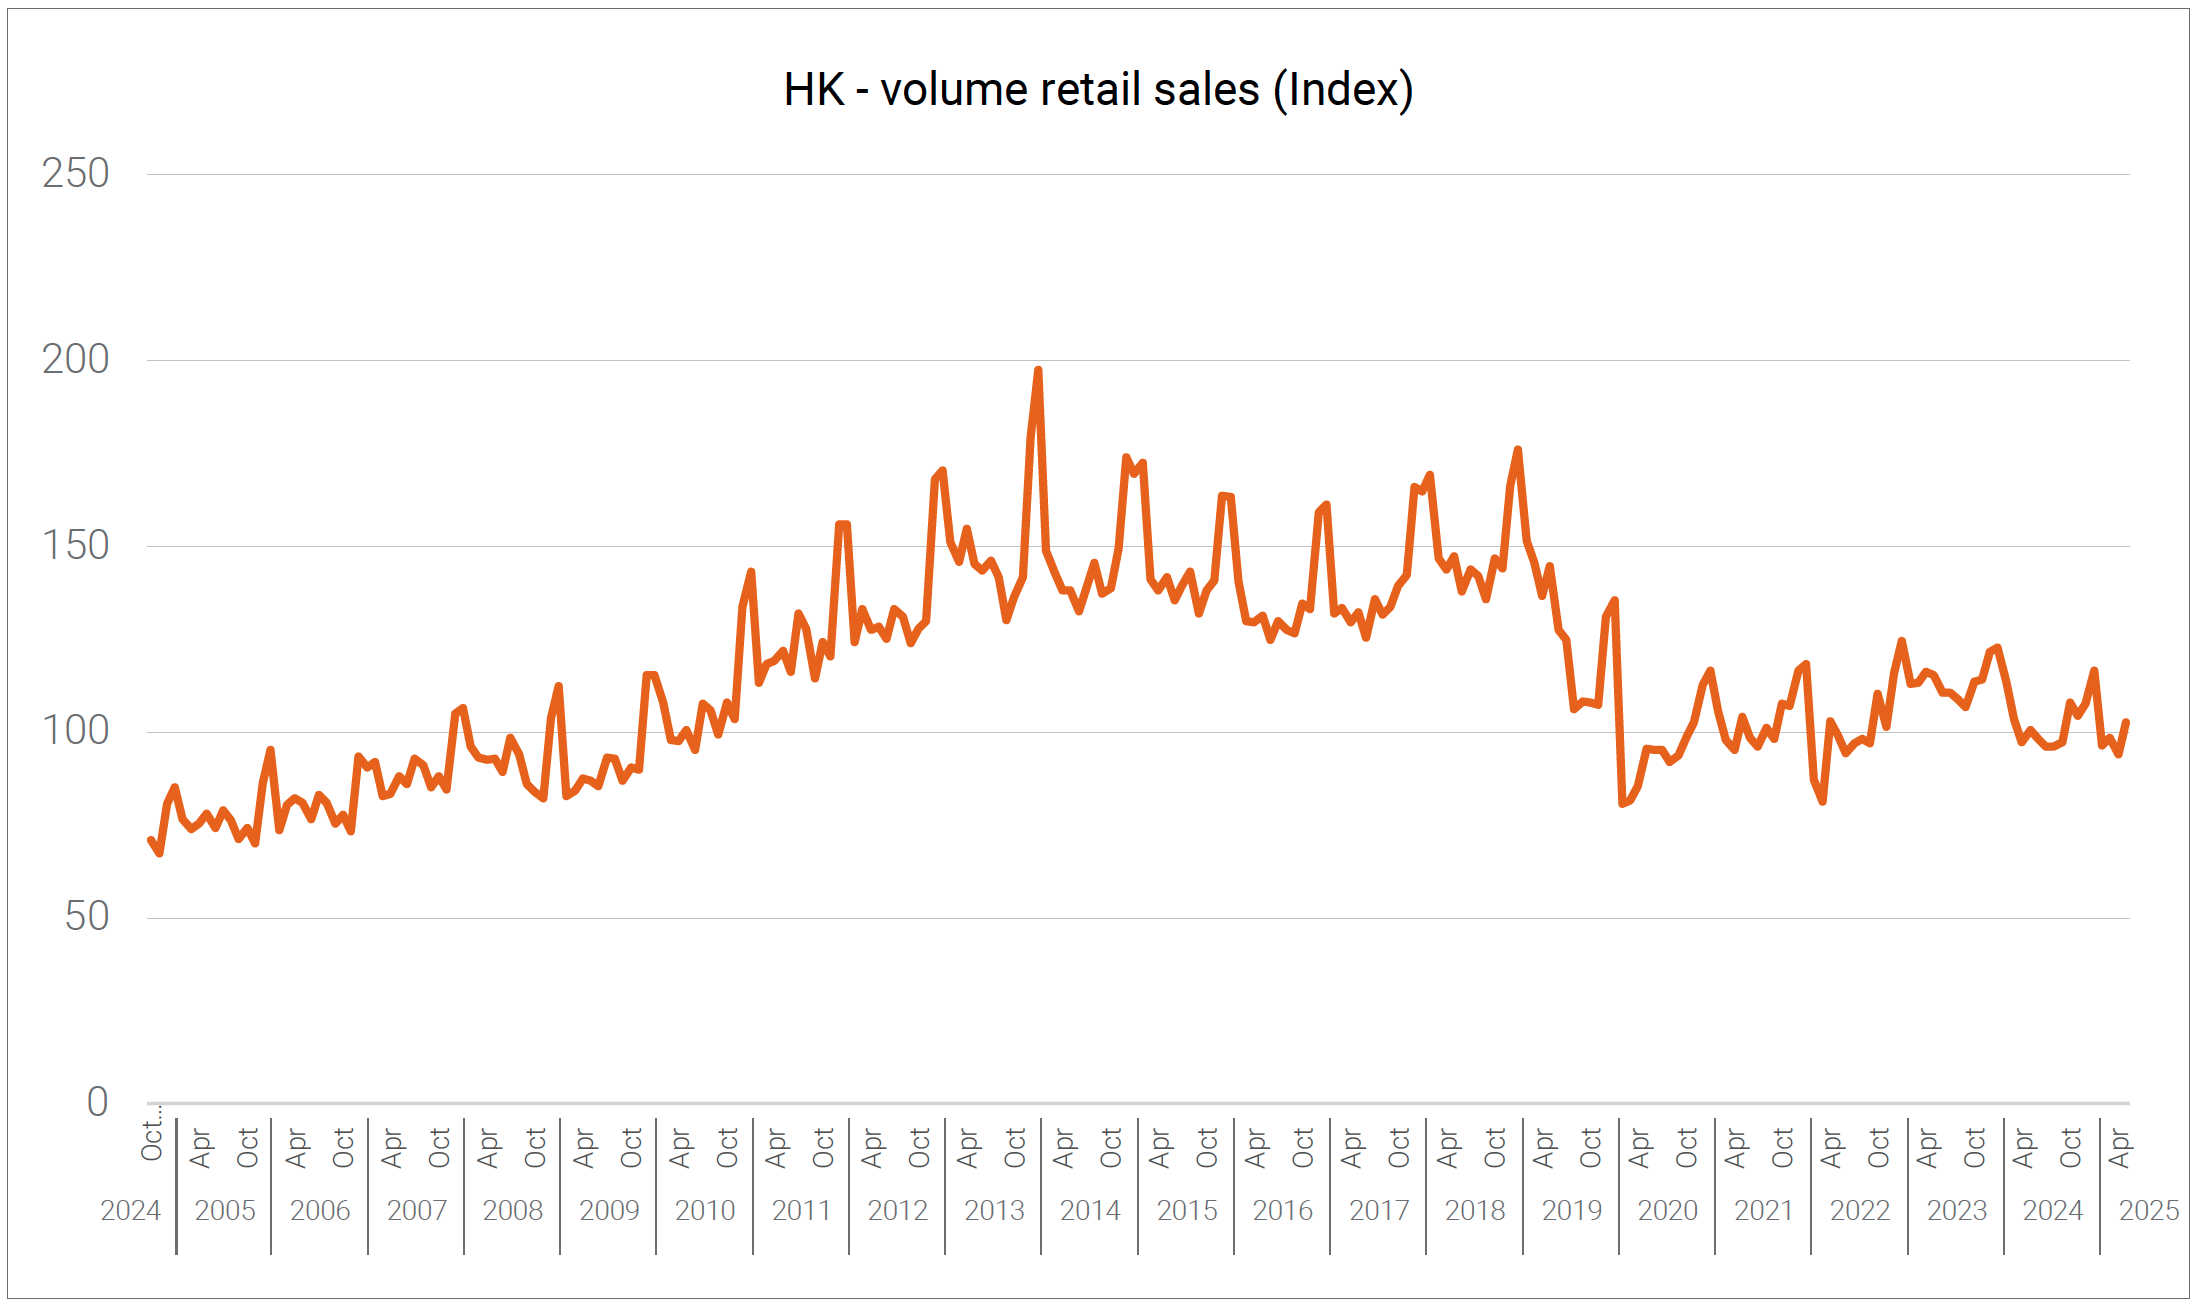
5. Hong Kong retail sales volume decline mirrors the great depression
 Source: Census and Statistics Department, Quay Global.
What it means
During the Great Depression in the 1930s, US real retail sales fell approximately 40% from their peak. A devastating collapse in real consumption.
Last month, Hong Kong posted its first real increase in retail sales since February 2024. However. this chart puts the ‘good news’ into perspective.
Like the US during the Great Depression, real (volume) retail sales in Hong Kong remain roughly 40% below levels recorded in 2018. Unlike the US, however, other major economic indicators (employment, investment) have not seen the same levels of distress.
Ten years ago, Hong Kong accounted for a meaningful portion of the global real estate universe (~10%). Today it’s around 2%. Hong Kong real estate companies may appear cheap, but the above chart is now looking more structural rather than cyclical. It’s one to watch.
6. Valuations still matter – Part 1
 Source: Bloomberg, Quay Global.
What it means
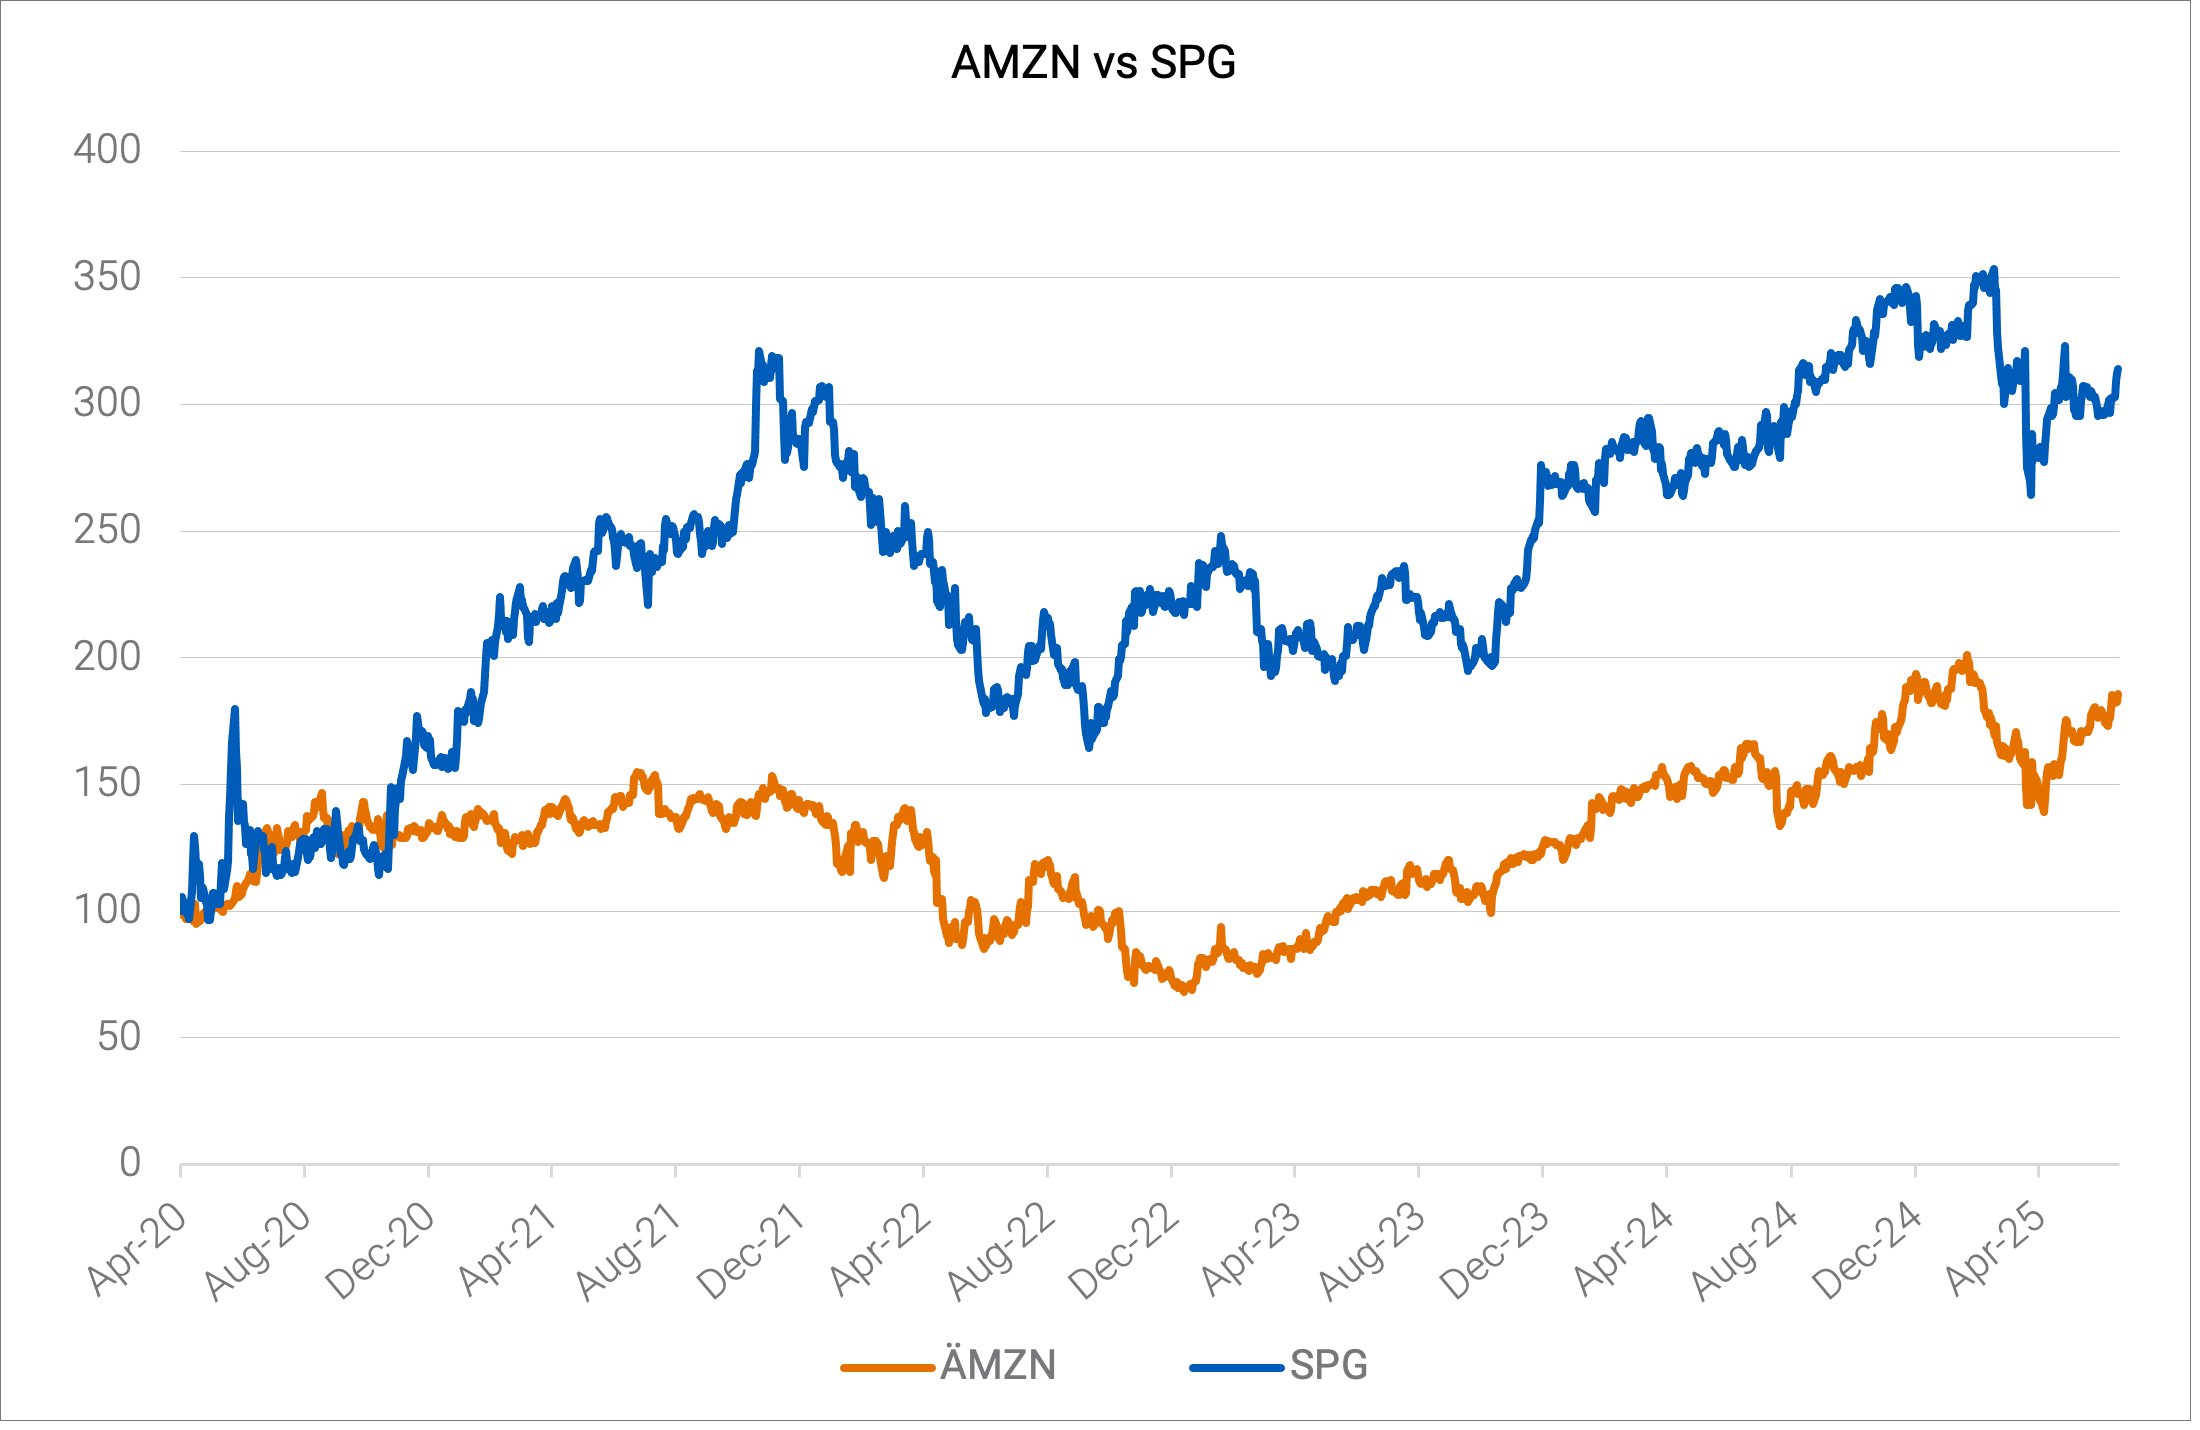
It’s April 2020. A global pandemic has been declared, and governments around the world have ordered shopping centres to close - while simultaneously ordering rent relief for tenants. At the same time, households are showered with stimulus and encouraged to ‘go spend’. With no physical retail to visit, it was obvious that spending was to be channelled through online retailers.
You work in an investment management firm and pitch the idea to sell Amazon (AMZN) - the quintessential online retail exposure - and buy Simon Property Group (SPG), the largest listed owner of malls.
Assuming you were not immediately fired for insanity, it turned out to be a cracking trade.
At the time, Amazon was trading 37.5x earnings. Simon Property Group? Just 4.6x.
In a market where value orientated managers are bemoaning the idea that ‘value no longer matters’, this is a powerful reminder that value always matters.
7. Valuations still matter – Part 2
 Source: Bloomberg, Quay Global.
What it means
On November 30, 2022, it seemed the world changed forever.
ChatGPT was launched, the artificial intelligence (AI) race had begun, and with it the insatiable need for data centres. Until then, the sector was awash with excess supply, patchy demand, and negative leasing spreads (ie falling rents).
But the birth of AI changed everything - suddenly a mega real estate theme was born.
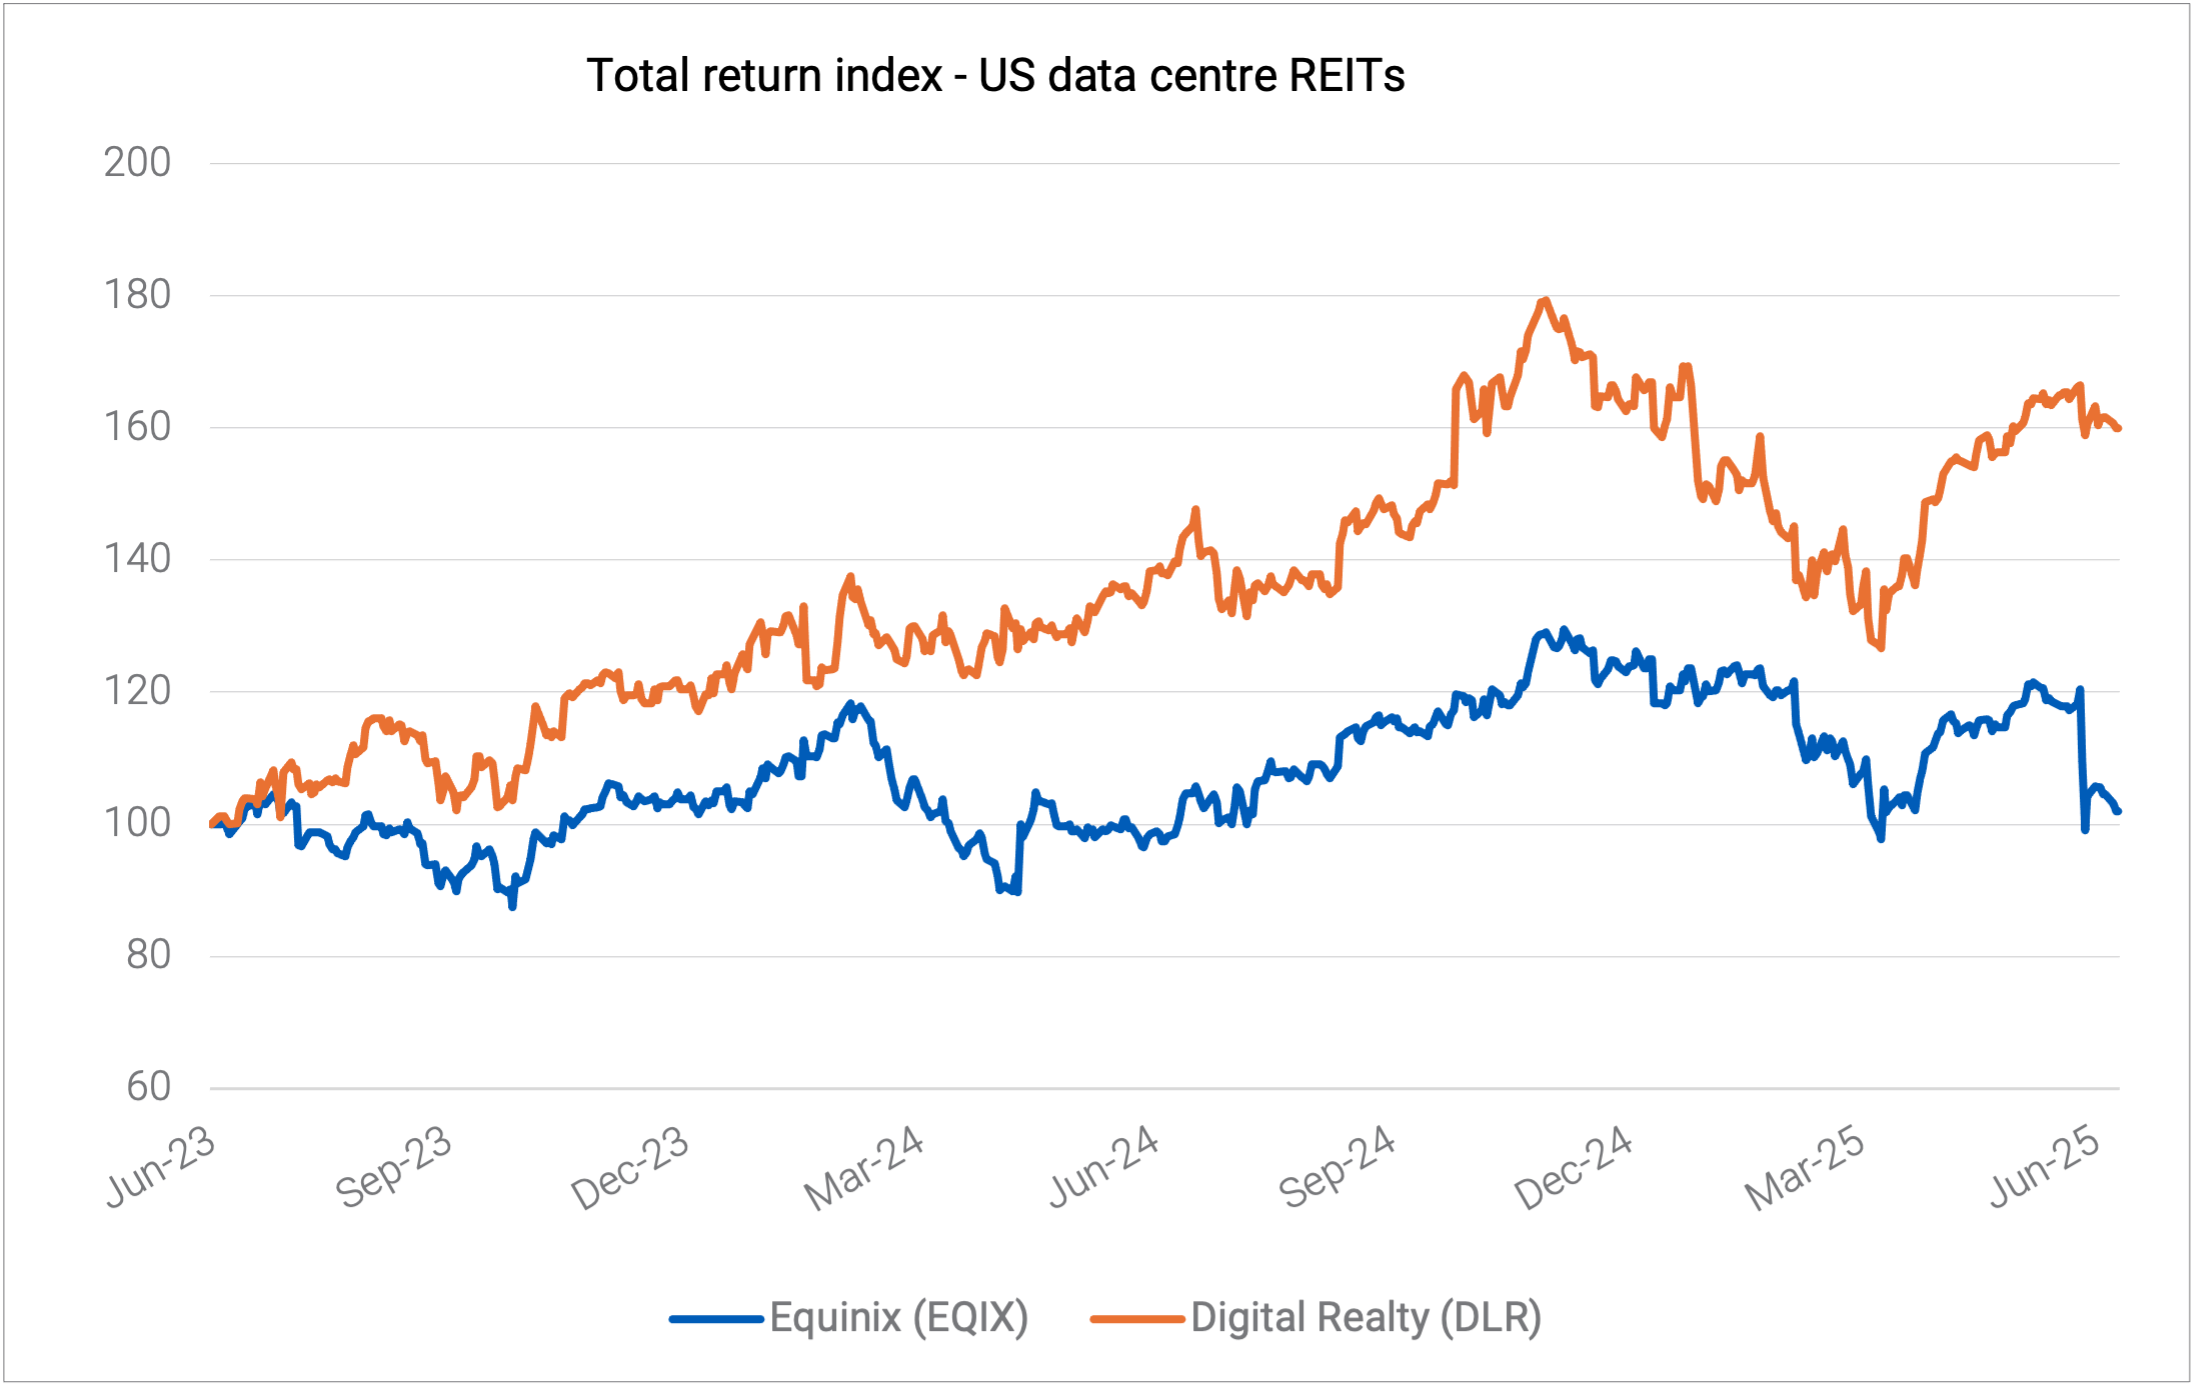
The two largest and most dominant REITs in this space are Digital Realty (DLR) and Equinix (EQIX). As the chart highlights above, DLR has meaningfully outperformed its peer over the past two years.
Part of this can be explained by DLR’s greater exposure to hyperscale tenants - where much of the demand is coming. Although that can’t explain why EQIX has delivered a near zero total return over two years despite such a clear tailwind. Again, one can-not look past the initial valuations.
Back in 2023, DLR was trading at 18x EBITDA while Equinix was at 24.3x. DLR was meaningfully cheaper.
Again, valuations matter.
8. Interest rate policy is not working (again) – New Zealand version
 Source: Reserve Bank of New Zealand.
What it means
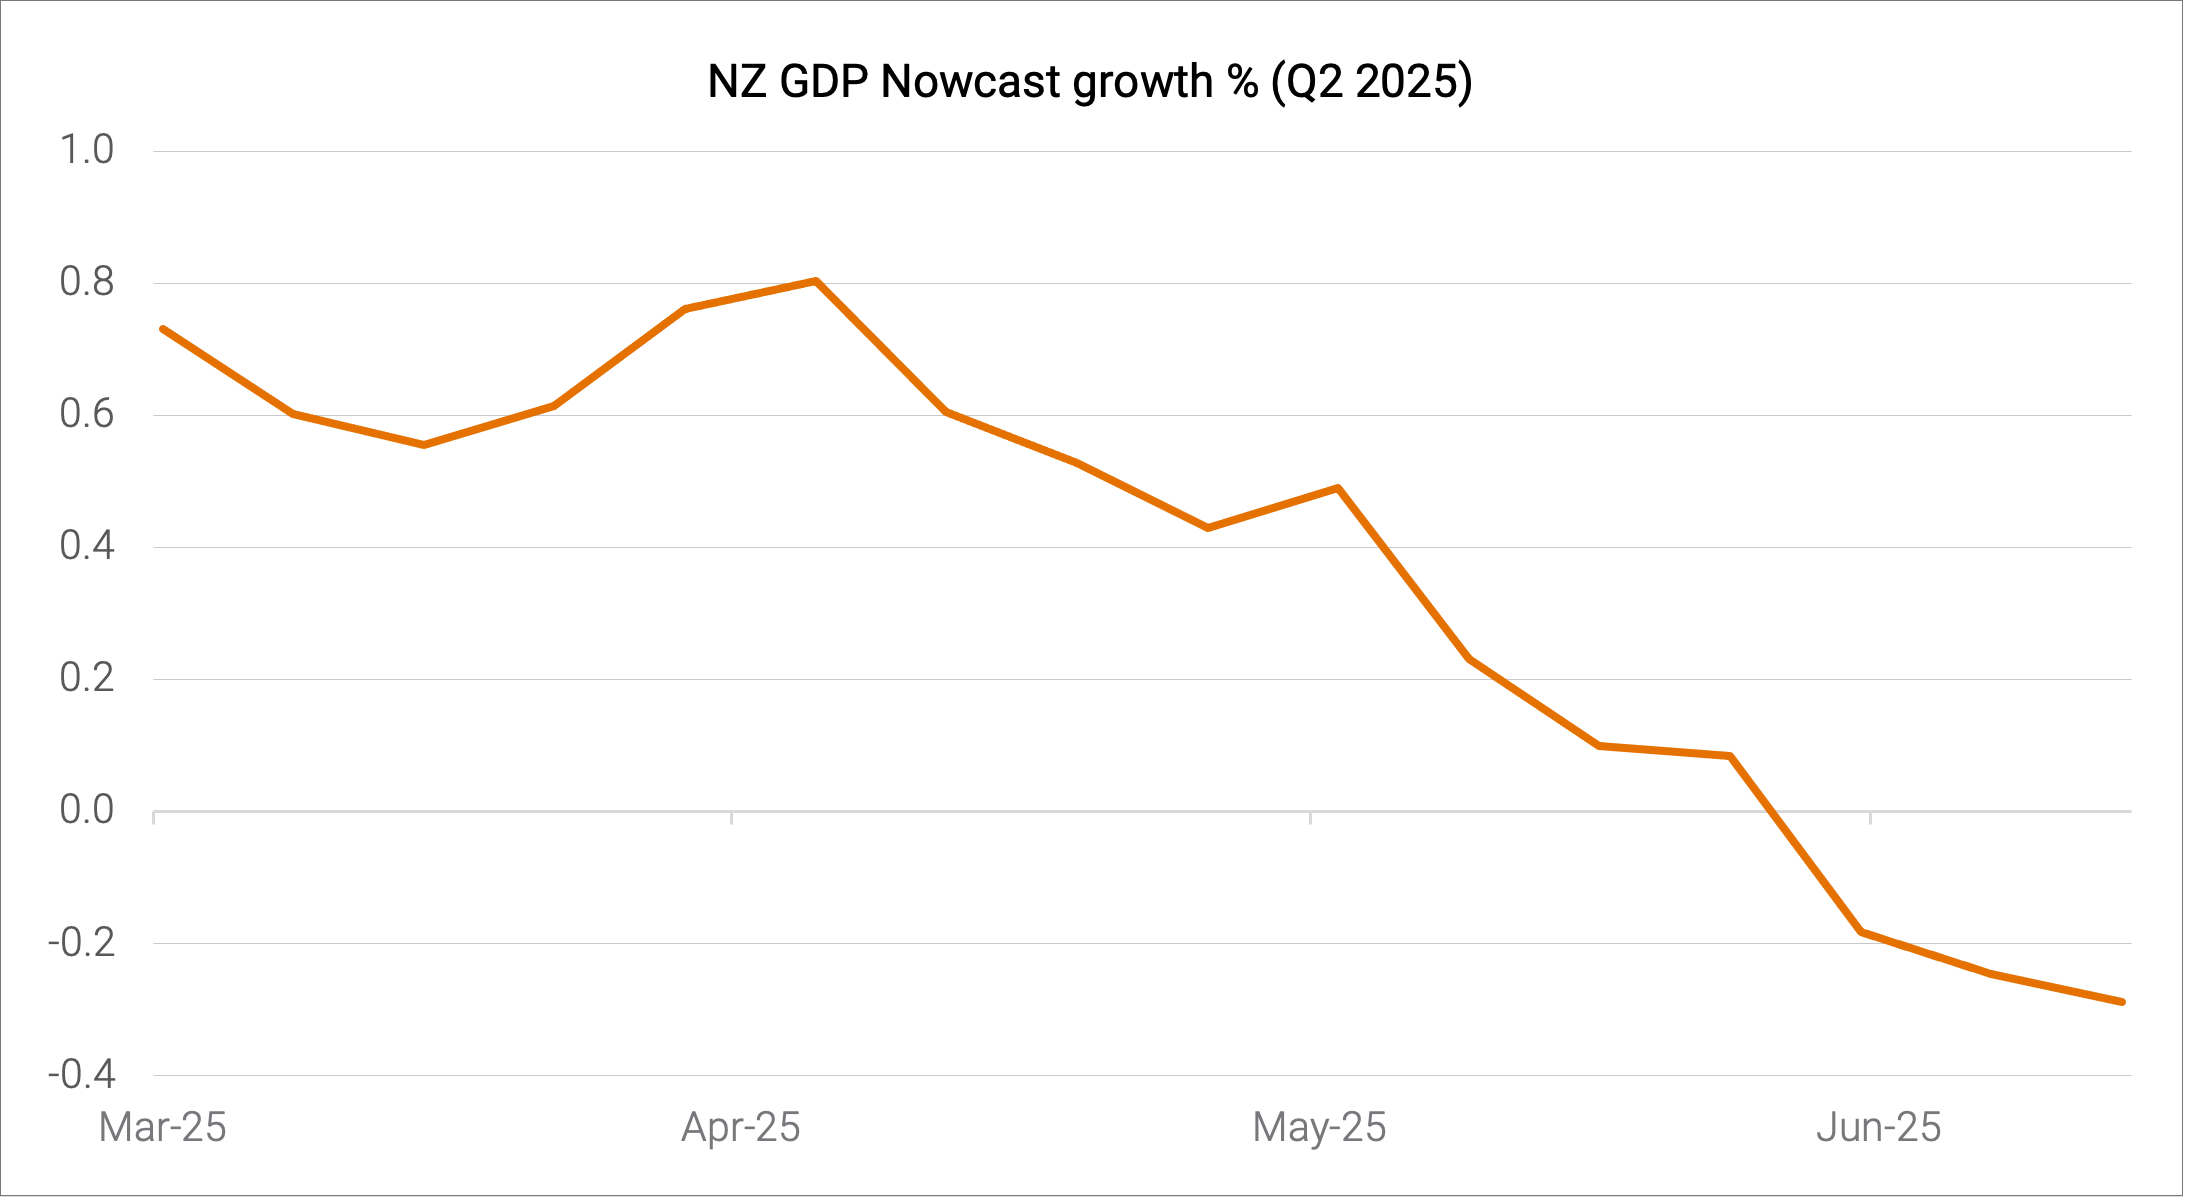
In response to global inflation, the Reserve Bank of New Zealand (RBNZ) raised interest rates aggressively from 0.25% (September 2021) to 5.5%. The economy contracted by 1% in both the second and third quarters of 2024. In response the RBNZ cut rates from 5.5% (August 2024) to 3.25% (May 2025).
The policy seemed to initially work. Growth rebounded to 0.5% (Q4 2024) and 0.8% (Q1 2025). However, as the chart above highlights, the RBNZ ‘GDP Now’ estimate points to contraction in Q2.
Just as investors and analysts overestimated the restrictive power of higher interest rates coming out of the pandemic, investors should remain wary of the risk of overestimating the positive impact of lower rates. A lesson for the RBA, perhaps?
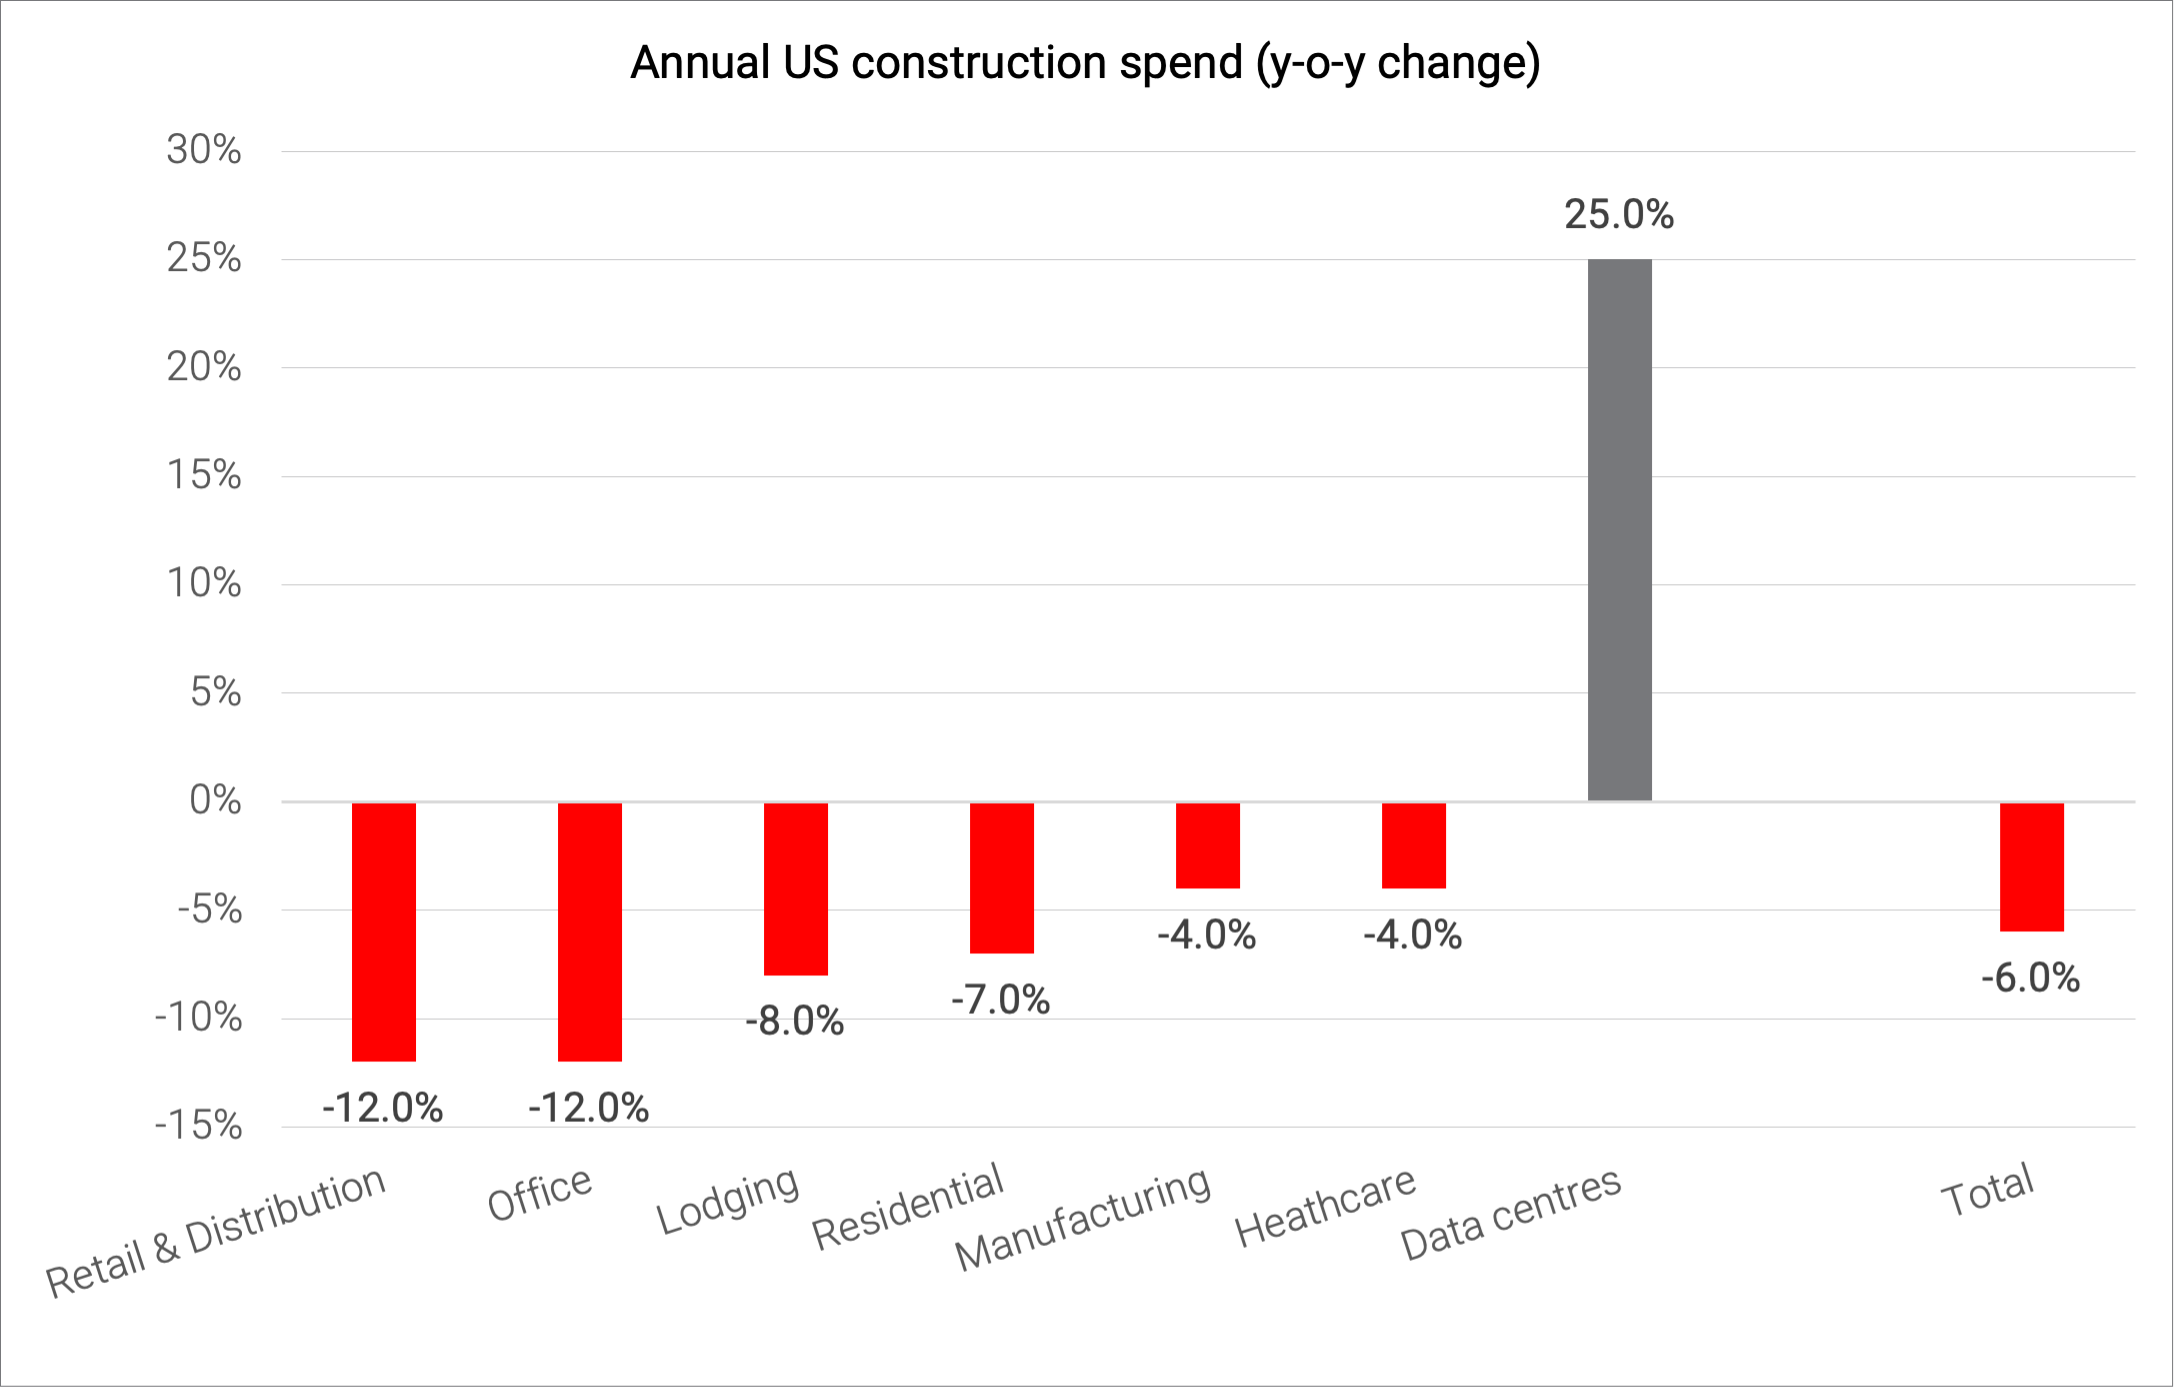
9. US commercial construction downturn is getting worse
 Source: US Census Bureau, Green Street, Quay Global.
What it means
For some time, we have highlighted the lead indicators for new commercial projects - such as the AIA billings index - foretelling a decline in US construction activity.
Last month, the US census bureau released construction spending data up to the end of May 2025 (arguably before the real impact of tariffs took hold).
For developers and builders, the data makes for grim reading. Outside of data centres (which accounts for just ~3% of total US construction spend), this is an industry in cyclical decline.
For owners of existing real estate, it’s good news. Today’s construction is tomorrow’s competition. And as competition wanes, rental tension will emerge.
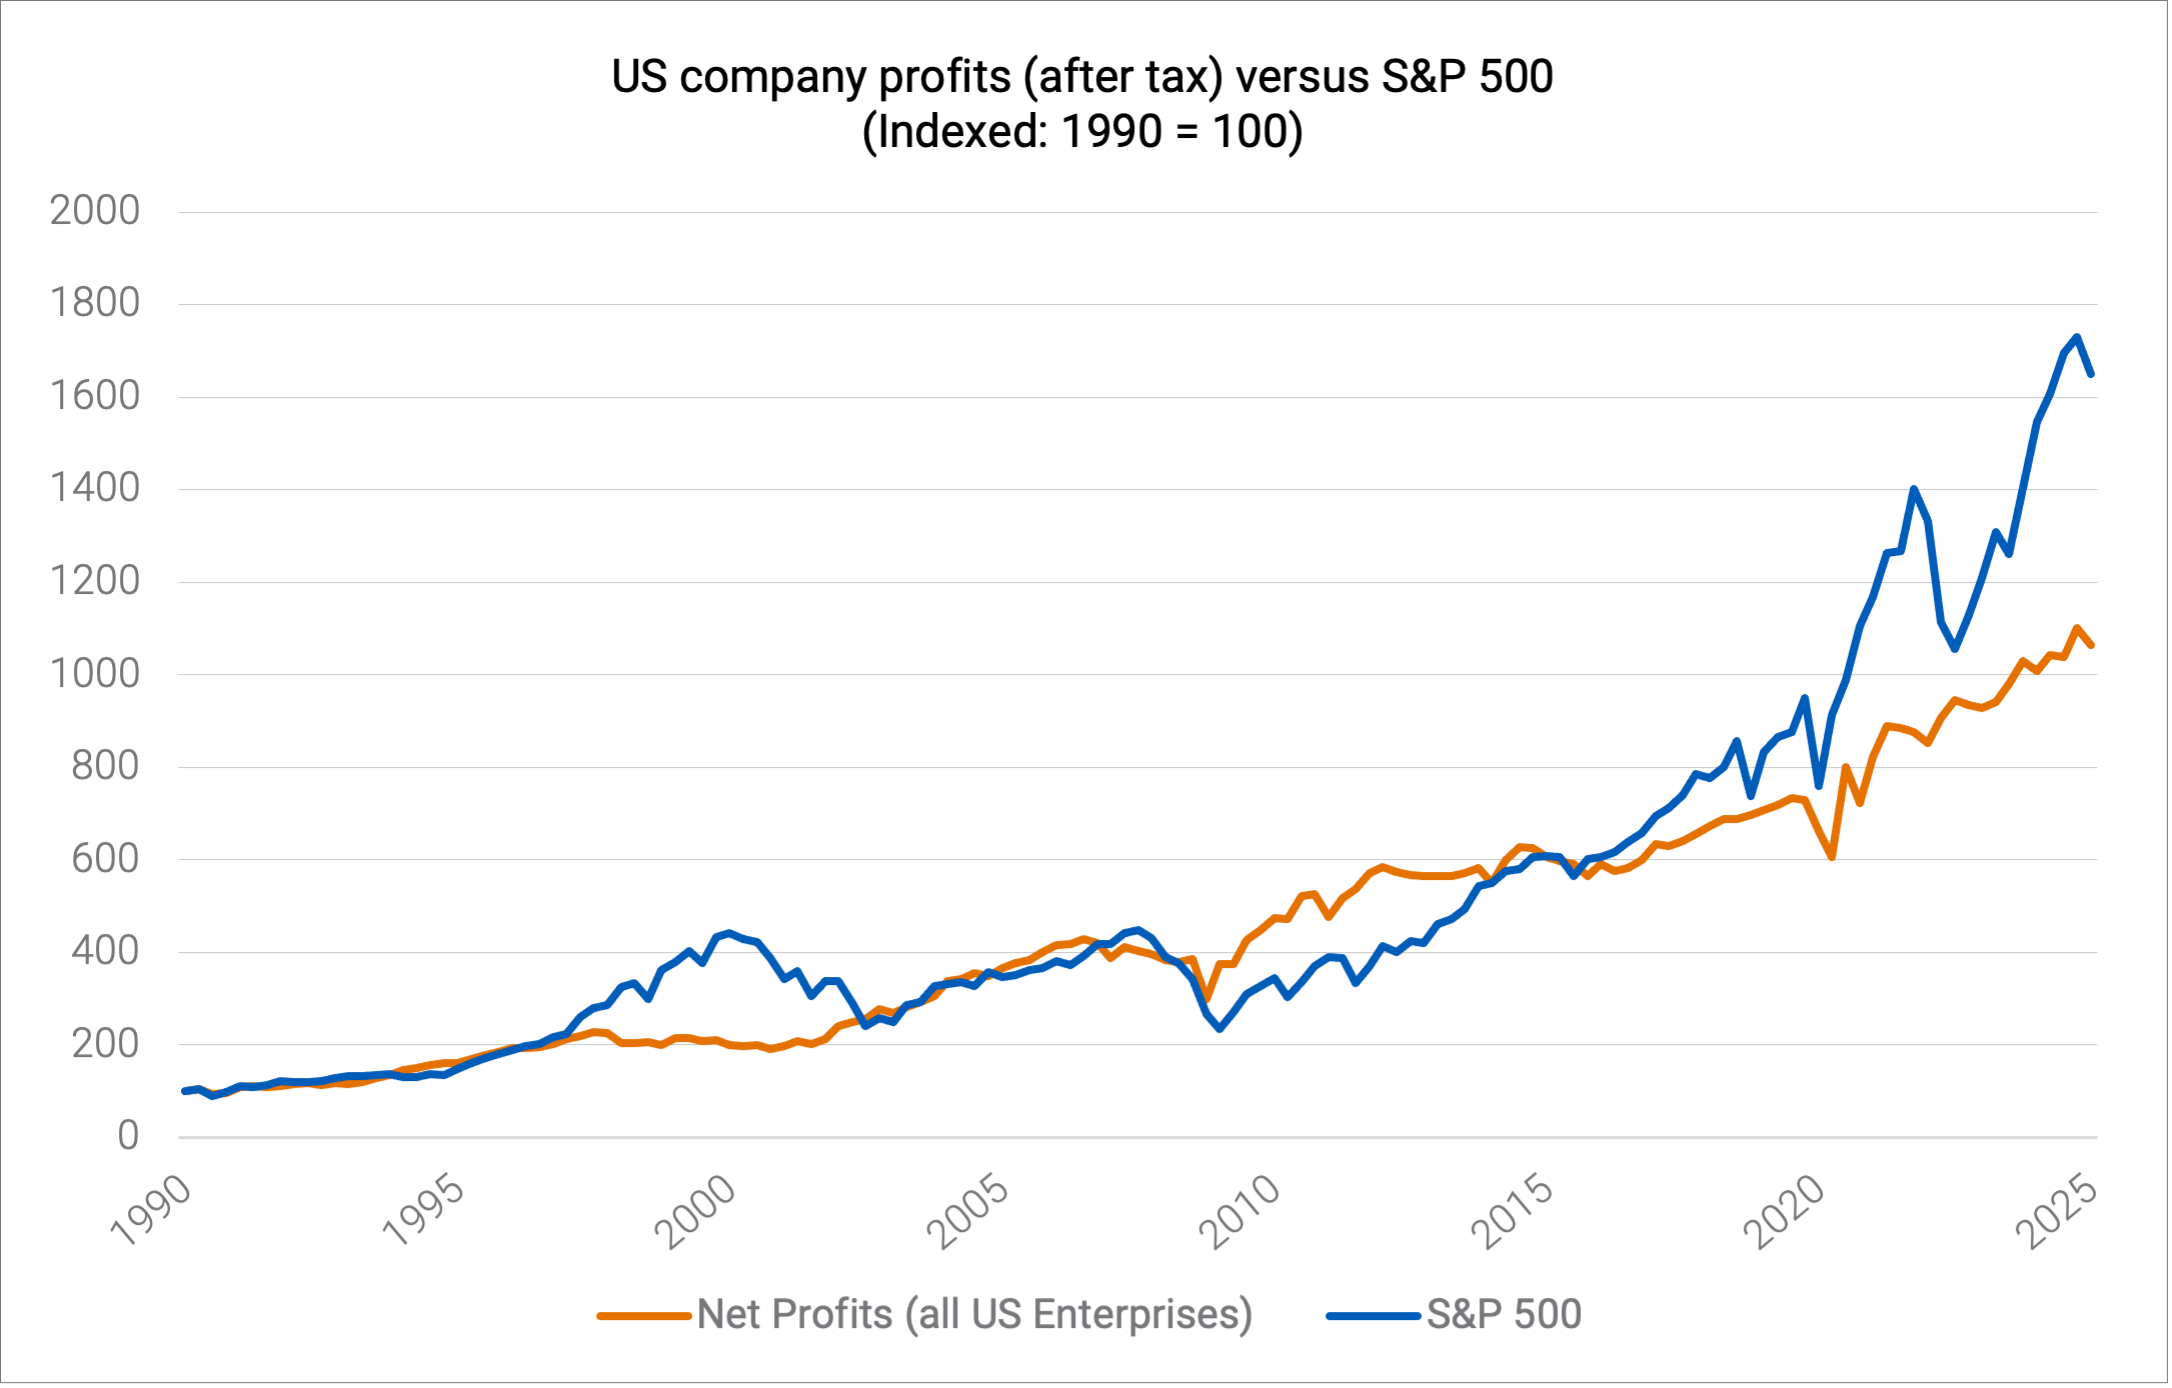
10. A lot of profit growth is expected in the US market…
 Source: US BEA NIPA Tables 1.12, Bloomberg, Quay Global.
What it means
For many years we have eschewed the idea that equity markets were driven by ‘excess liquidity’ or ‘a Fed Put option’ and pointed to the long-term relationship between profit and share market performance.
When updating our analysis above, we were a little surprised to see the current disconnect. Clearly profit growth has been healthy in the US, but it seems the S&P500 is running ahead of fundamentals – perhaps anticipating accelerating profits, or maybe reflecting the vibes of a new ‘tech boom’.
The above chart also shows this disconnect has happened in the past, during the ‘old tech boom’. And while long-term new technologies (such as AI) may have a profound influence on the economy and profits in years to come, it could also be true that markets are getting a little ahead of themselves, as they have done in the past.
Of course, this disconnect can last for years, but it does suggest the downside risk to markets (in the event of an economic shock) is significant.
The content contained in this article represents the opinions of the authors. The authors may hold either long or short positions in securities of various companies discussed in the article. The commentary in this article in no way constitutes a solicitation of business or investment advice. It is intended solely as an avenue for the authors to express their personal views on investing and for the entertainment of the reader.