


While Mr Chanos can sometimes be characterised as a perma-bear (his business did focus on short selling stocks), this comment is a nice encapsulation of the current equity cycle. Mr Chanos, whether he knows it or not, is channelling a key aspect of the Kalecki profits equation – a subject we have written about in the past, that we believe may help understand how the current cycle may play out.
A Kalecki refresher
We covered the Kalecki equation in June 2021 and November 2025. In both papers we were constructive on the US equity market and company profit outlook, even in the face of rising interest rates (2021) and Tariffs (2025). This time, we feel more cautious.
As a reminder, the equation states that company profits are simply company savings plus any paid dividend. And company savings are national savings1 less any savings accrued to the government, households, or foreign sectors.
Using known accounting identities, the Kalecki profits equation can identify the macroeconomic source of all past company profits – to the dime.
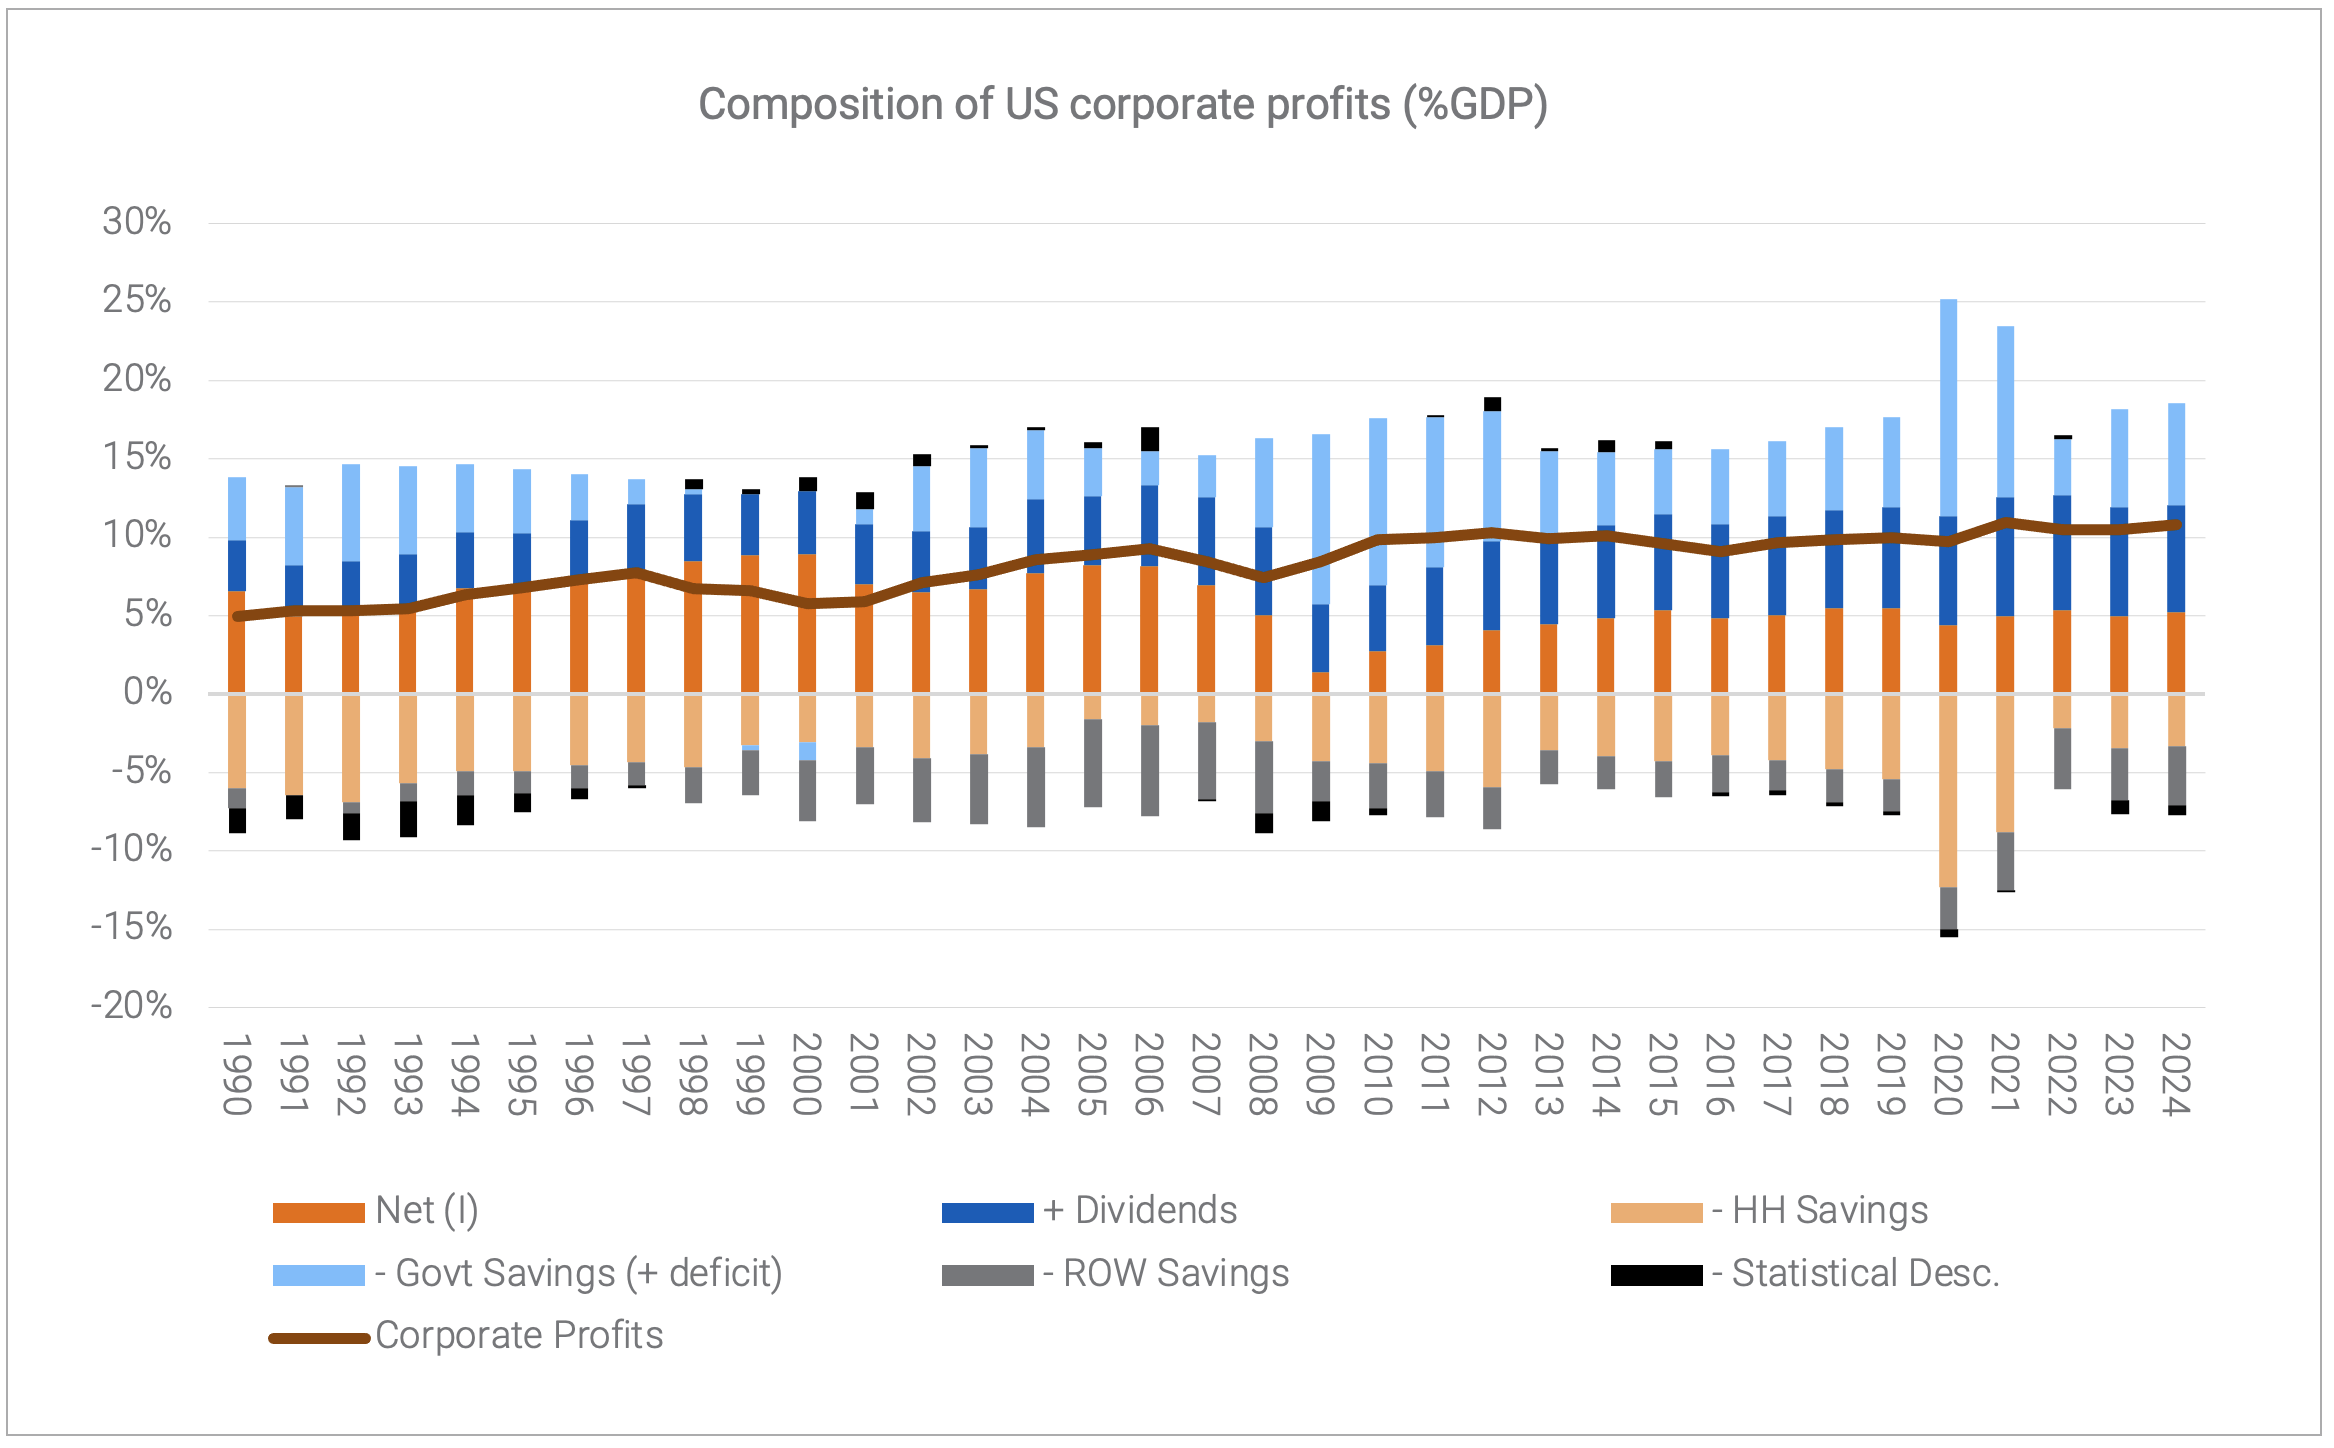 Source: Z1 flow of funds, Quay Global.
The limitation of the equation is that it is not very useful in making forecasts, as to do so, one would require very accurate predictions of each of the equation’s inputs.
However, by understanding these inputs we can identify opportunities and the vulnerabilities in the corporate profit outlook.
The current environment
In our two previous papers on this topic we had a positive outlook for US company profits and hence equity returns. The source of this optimism was the large and sustained federal deficit which, in the US, appears to be under no immediate threat from the so-called Deficit-Hawks, all of whom appear to have gone into hiding. Government deficits are ‘negative savings’ and therefore add to corporate profits – hence the strong equity and profit cycle since COVID.
In our 2025 paper we highlighted the surge in new investment (particularly AI-related investment) as an additional source of company earnings. And as Mr Chanos quite rightly points out, net investment can be a tremendous driver of corporate profits as revenues from suppliers are immediately recognised as a profit item, while the expenditure of the buyers are capitalised and depreciated over time by another party.
Where we differ from Mr Chanos’ quote is we do not see the capex cycle as a source of “Magic Profits”. Rational investment is a source of sustainable profits. For example, building a much-needed house creates income for the builders and suppliers, and an asset for the owner, reflecting net wealth (investment) for society. It is impairment to asset values (negative investment), which drives lower profits (savings) impacting associated asset values and the economy. And assets face impairment when they cannot generate adequate returns on capital.
The investment cycle has taken over the deficit cycle
Most investment professionals would be acutely aware of the significant AI-related capex cycle, which seems to be accelerating each year. In the informational and software space, net investment as a proportion of GDP now comfortably exceeds the 2000 dot-com boom.
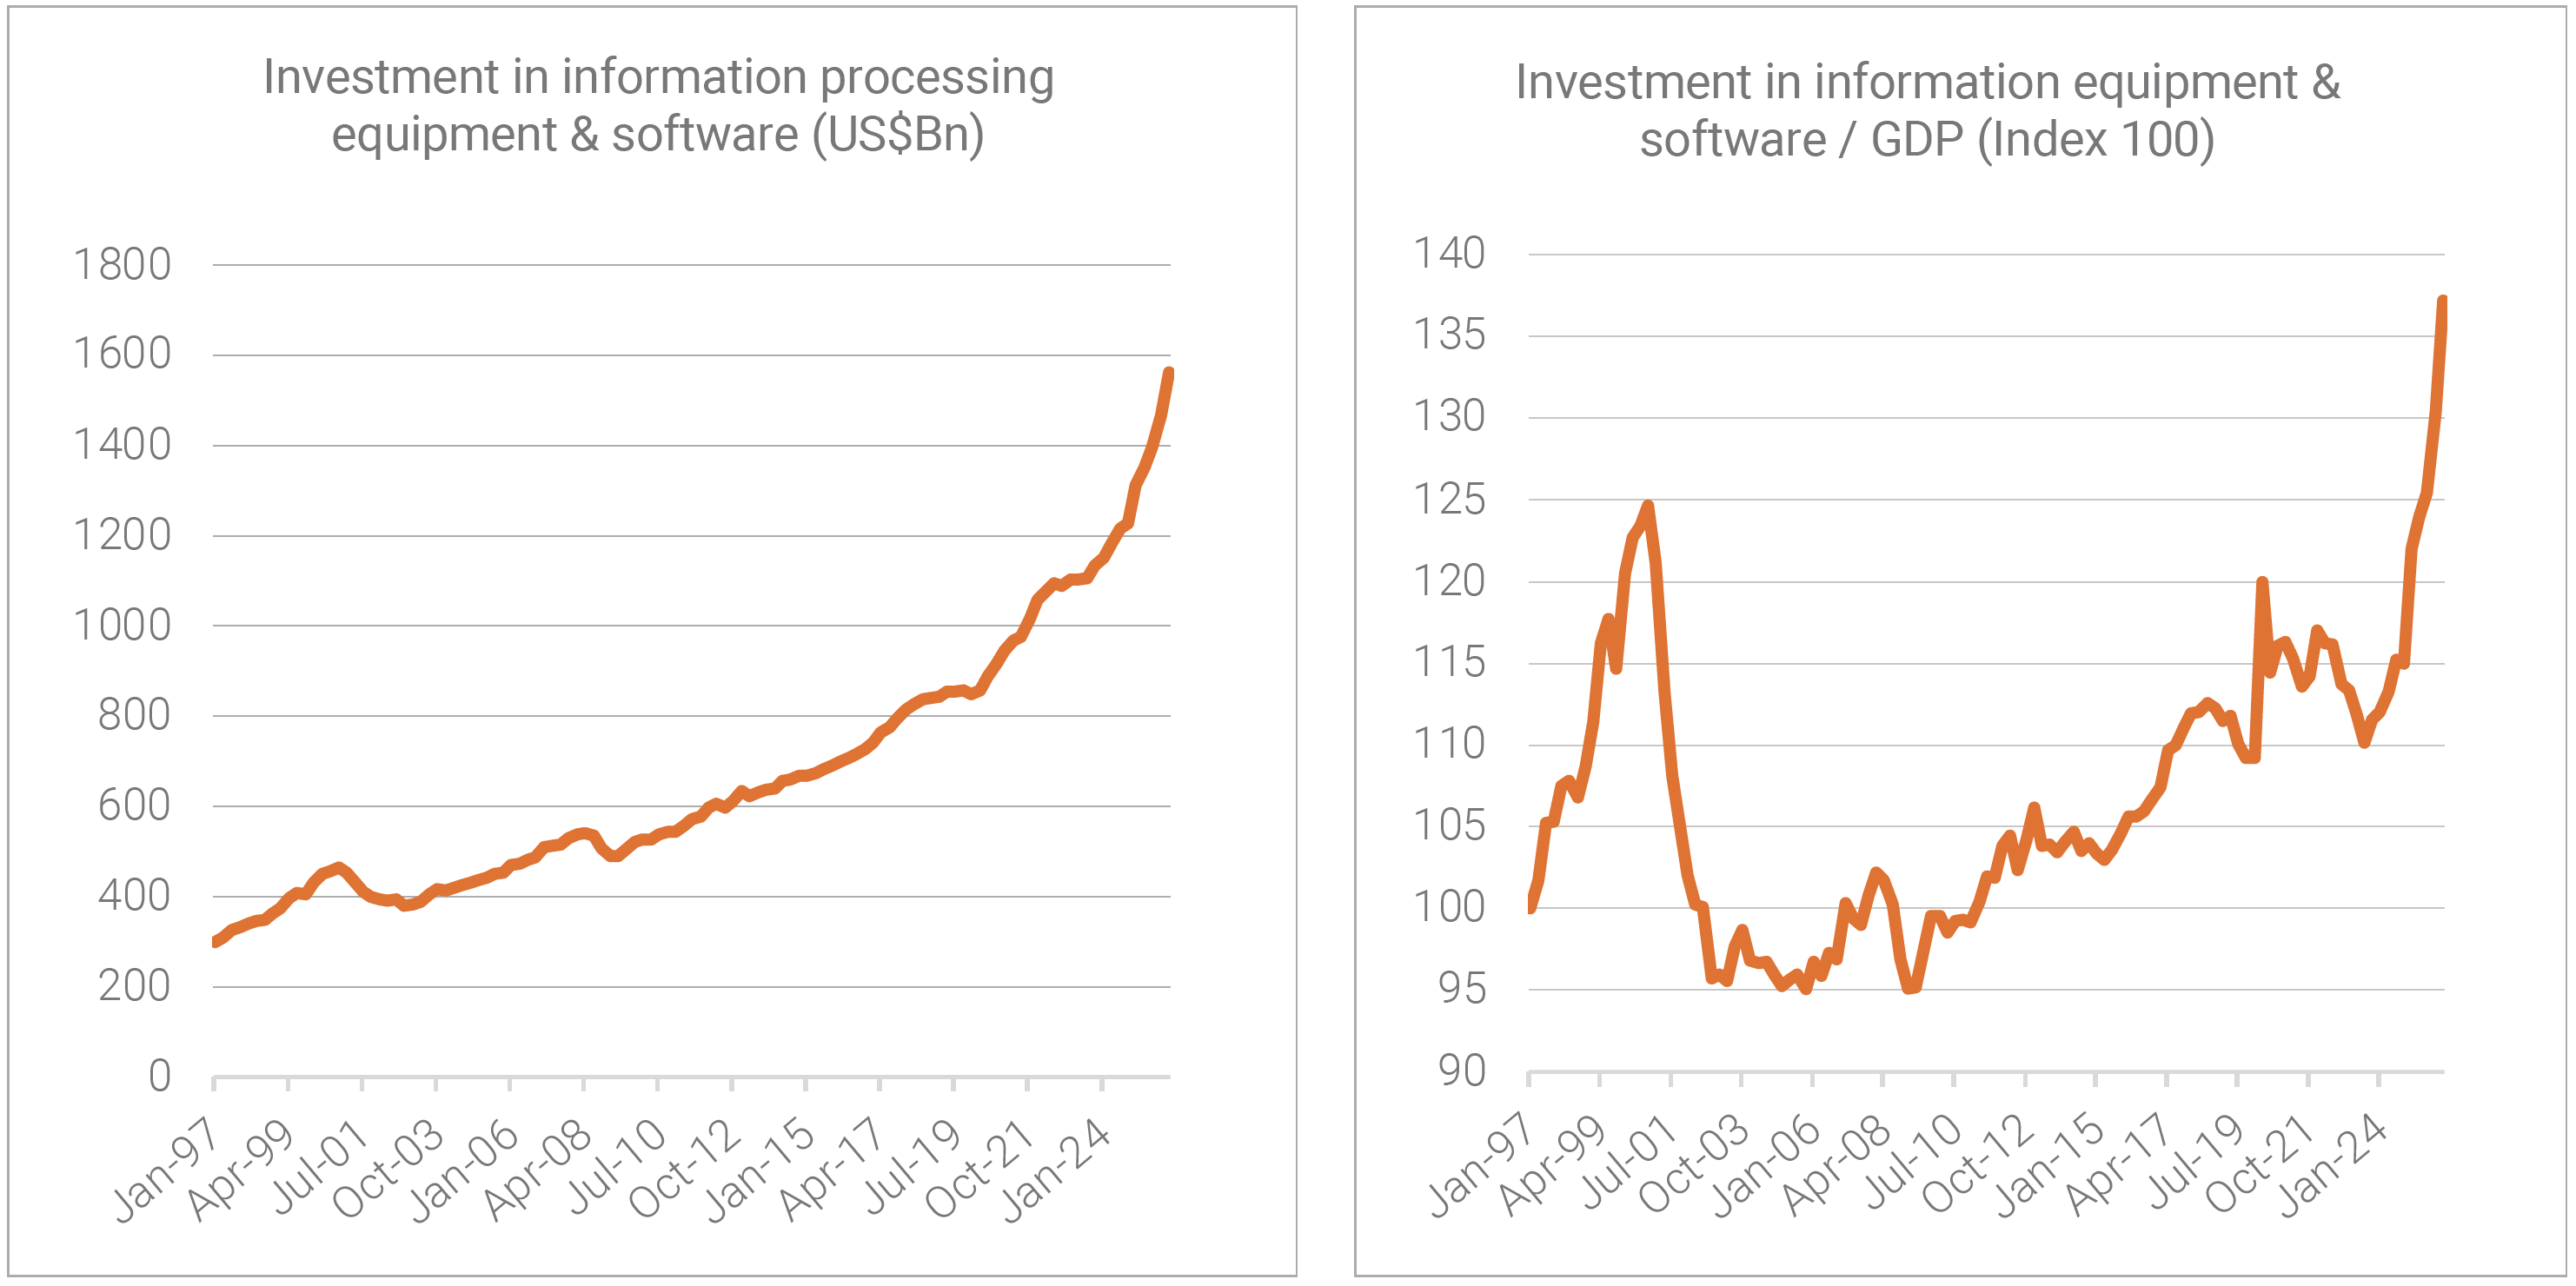 Source: BEA, Fred, Quay Global.
It should therefore be no surprise, using Kalecki as our framework, that expectations for company profits are surging at the same time. These rapidly increasing profits in turn are driving share market returns all the while making ‘PEs’ look reasonable.
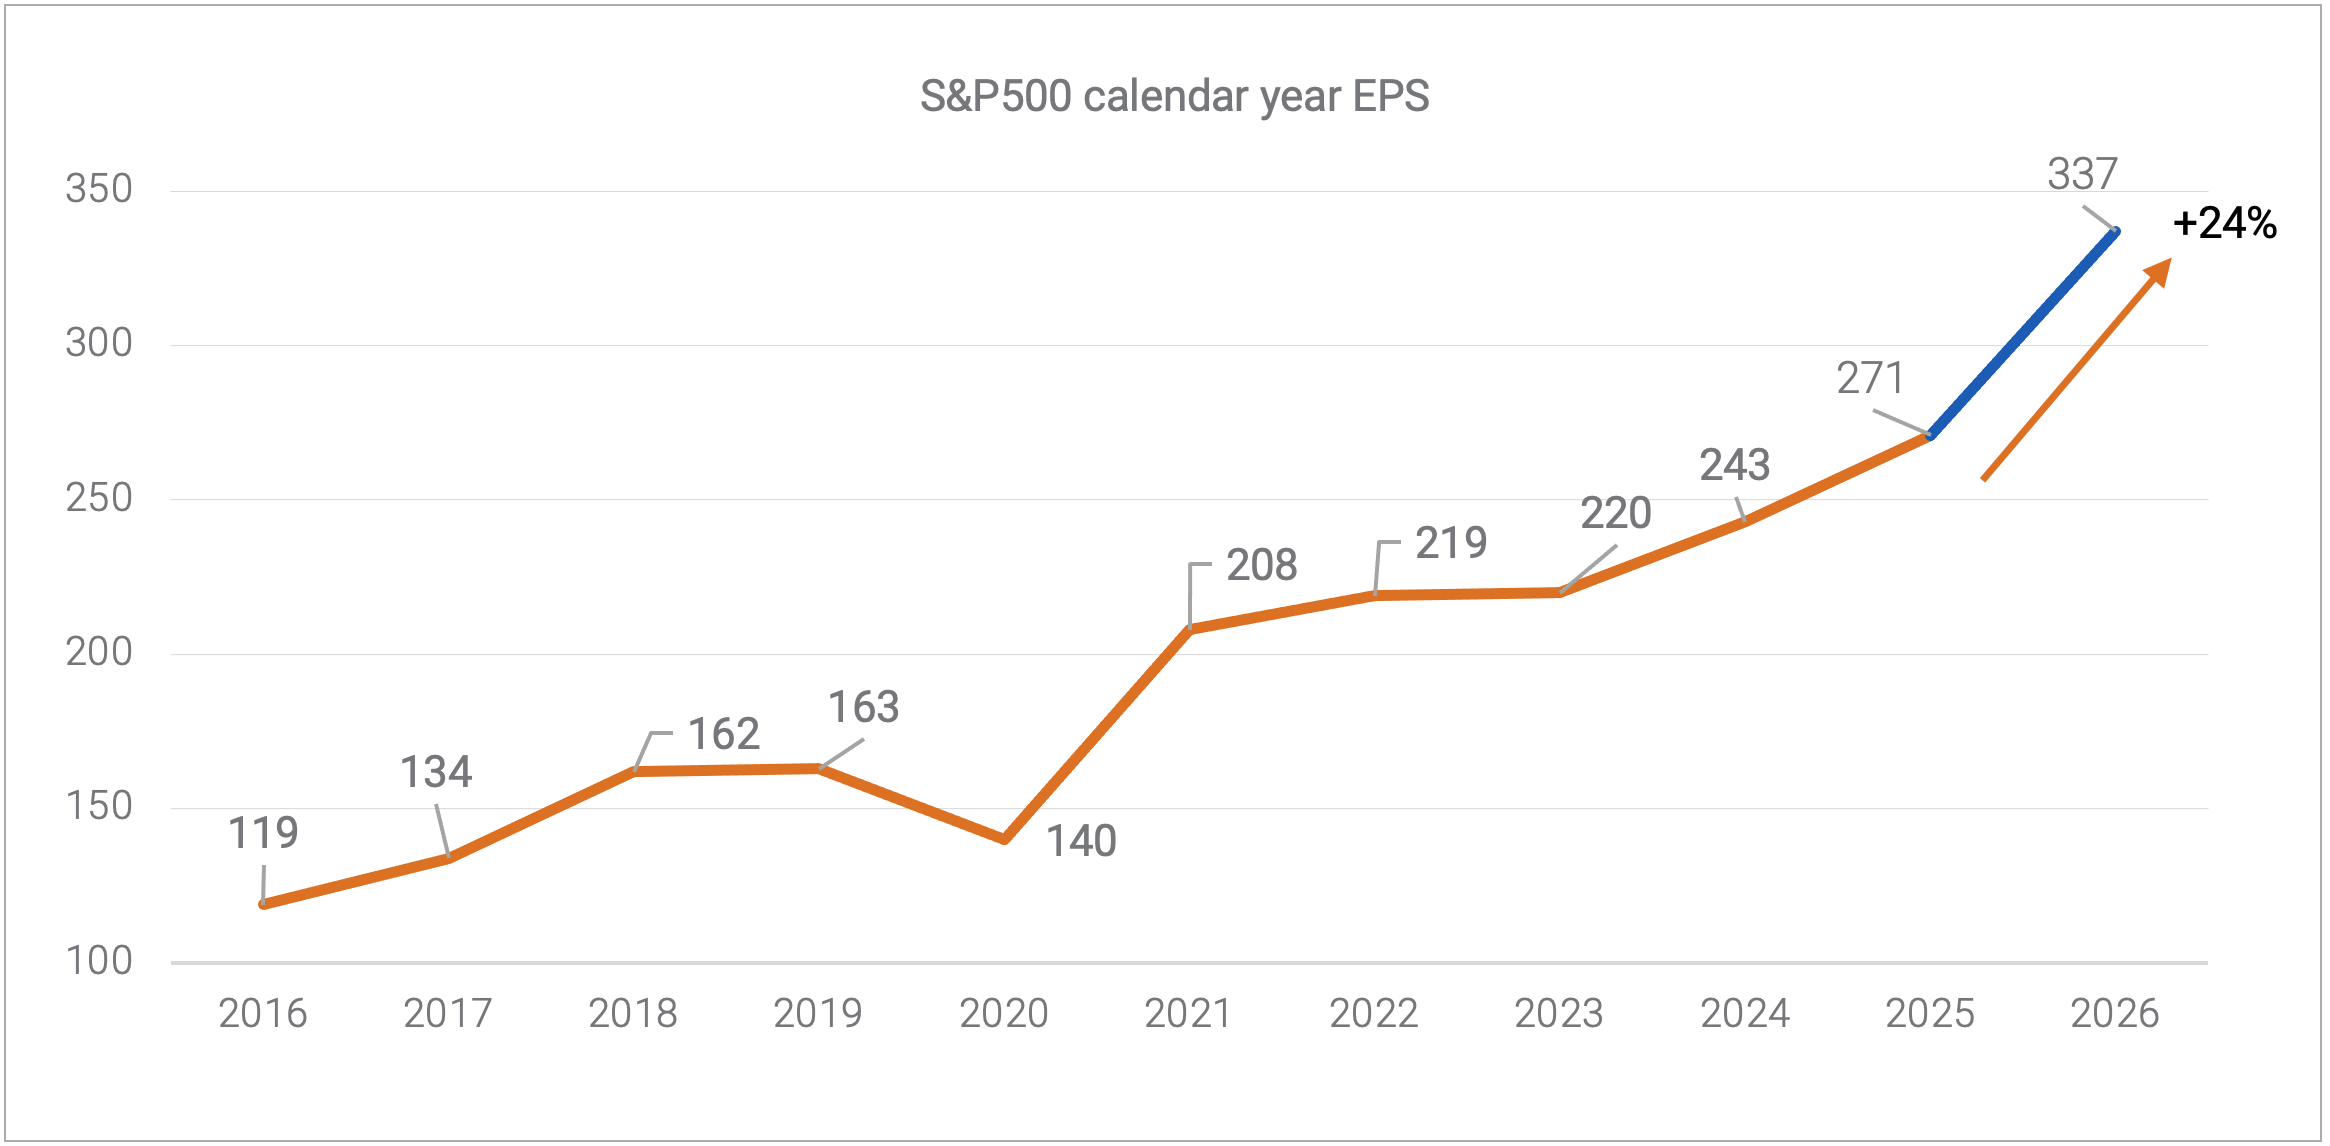 Source: FactSet, Charlie Bilello.
How it ends - or does it end?
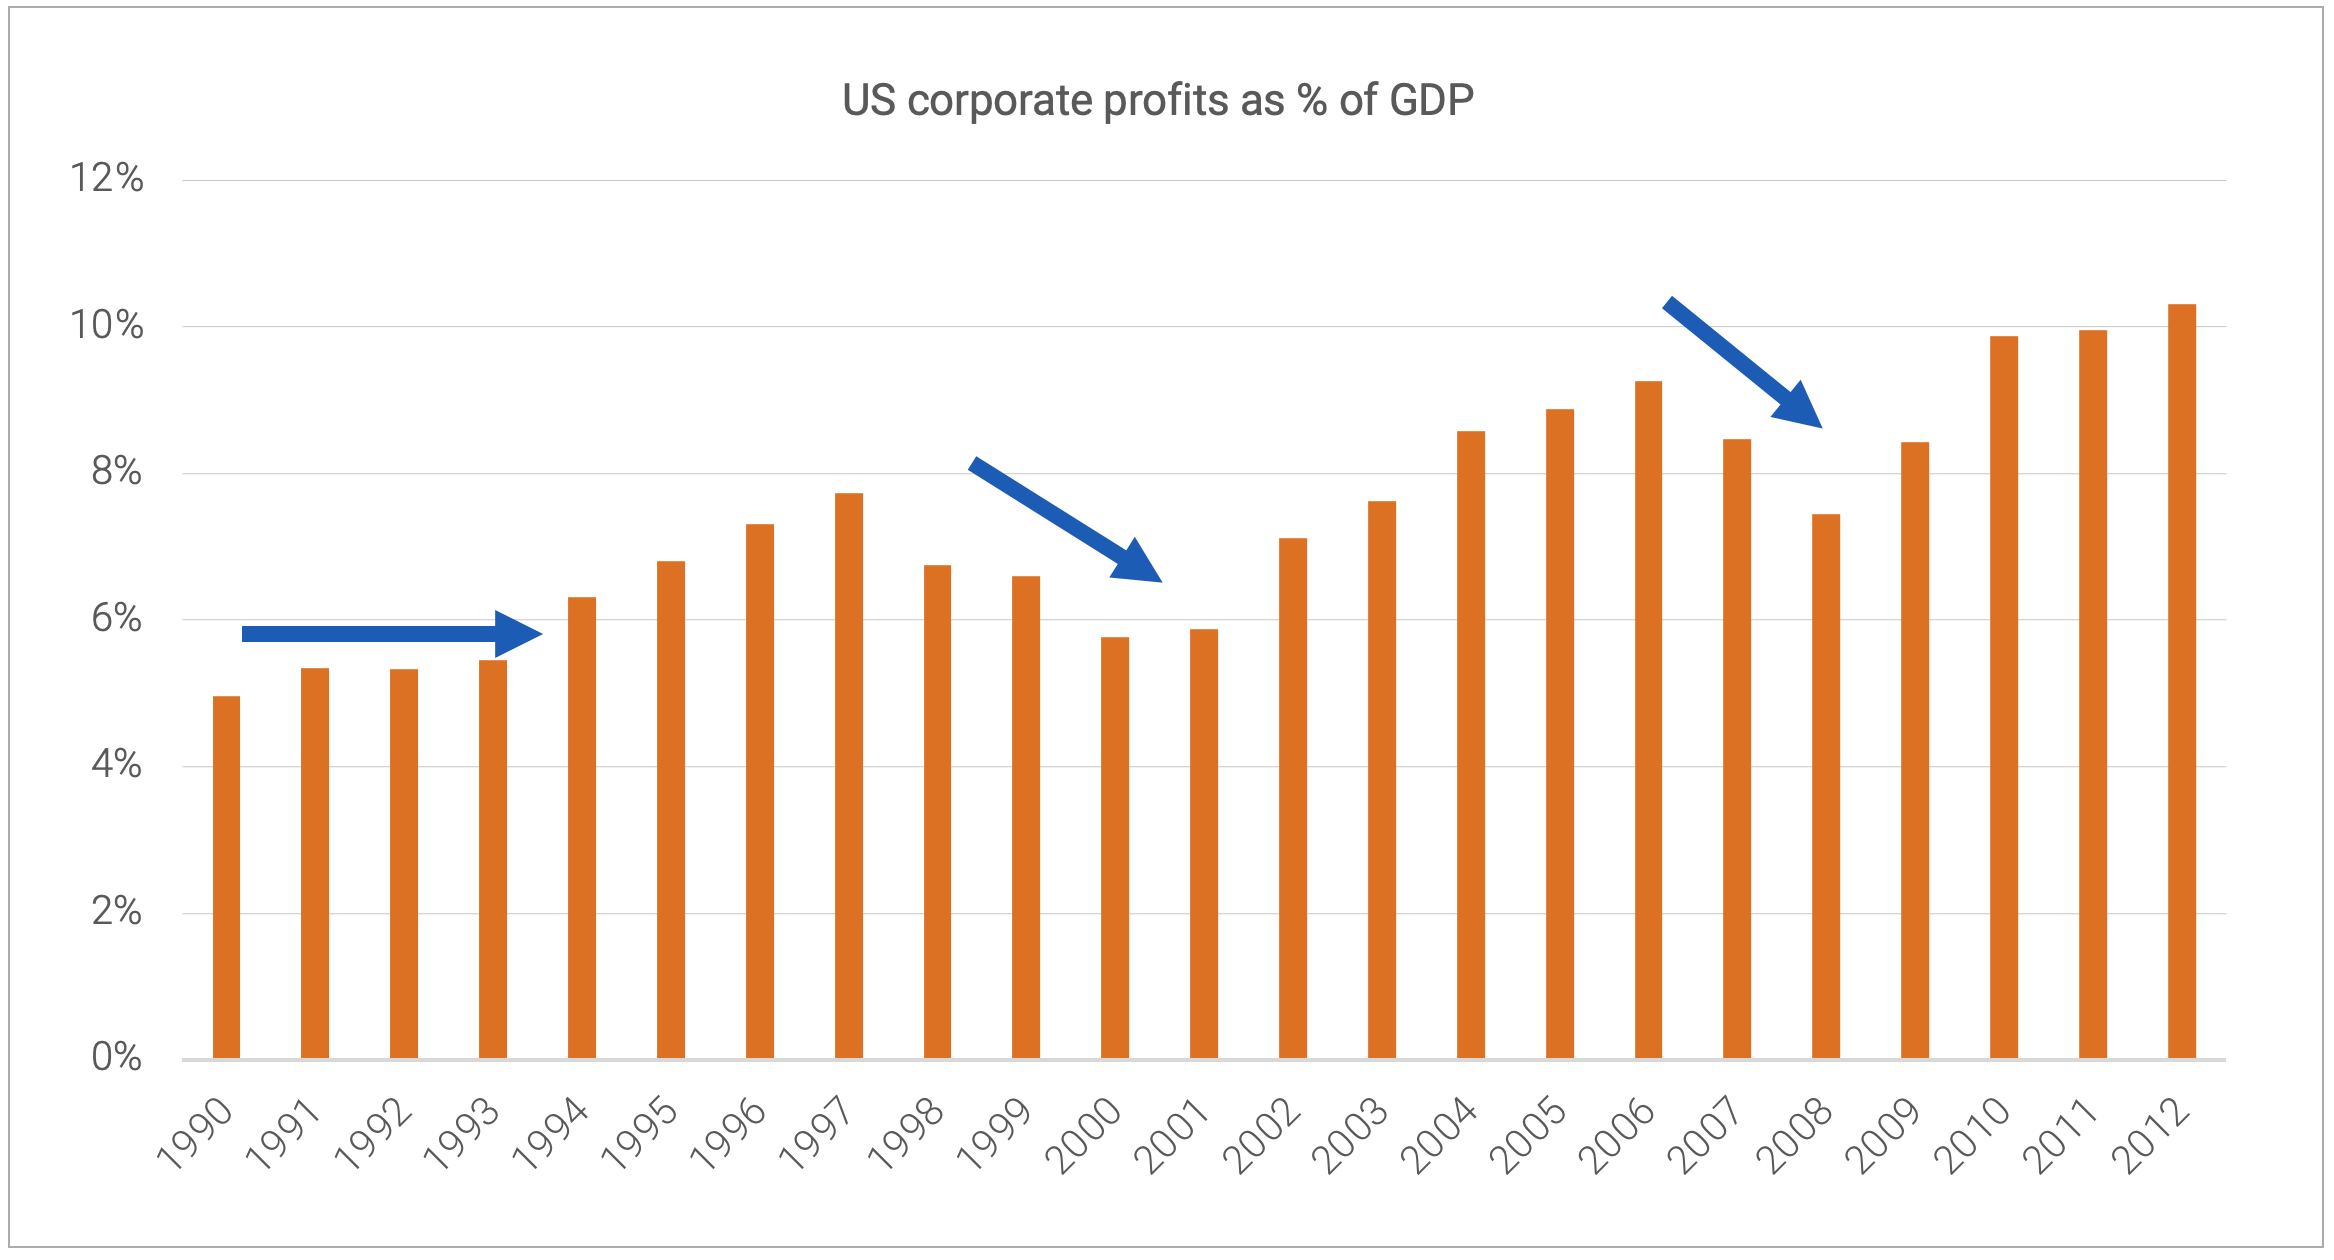
Capex cycles are nothing new. In the US, there have been three notable cycles since 1988:
- The commercial real estate boom, which turned into the Savings and Loan crisis (1988–90).
- The dot-com cycle, and over-investment in fibre-optic cable and related infrastructure (1996–2000).
- The GFC, and over-investment in US residential property (2004–2007).
On each occasion initial investment drove profits and hence share market returns. And on each occasion, the excess capacity created by such investment led to losses on capital, write downs and a slash in spending. This led to a fall in net investment, profits (buffeted somewhat by larger fiscal deficits), and ultimately the share market.
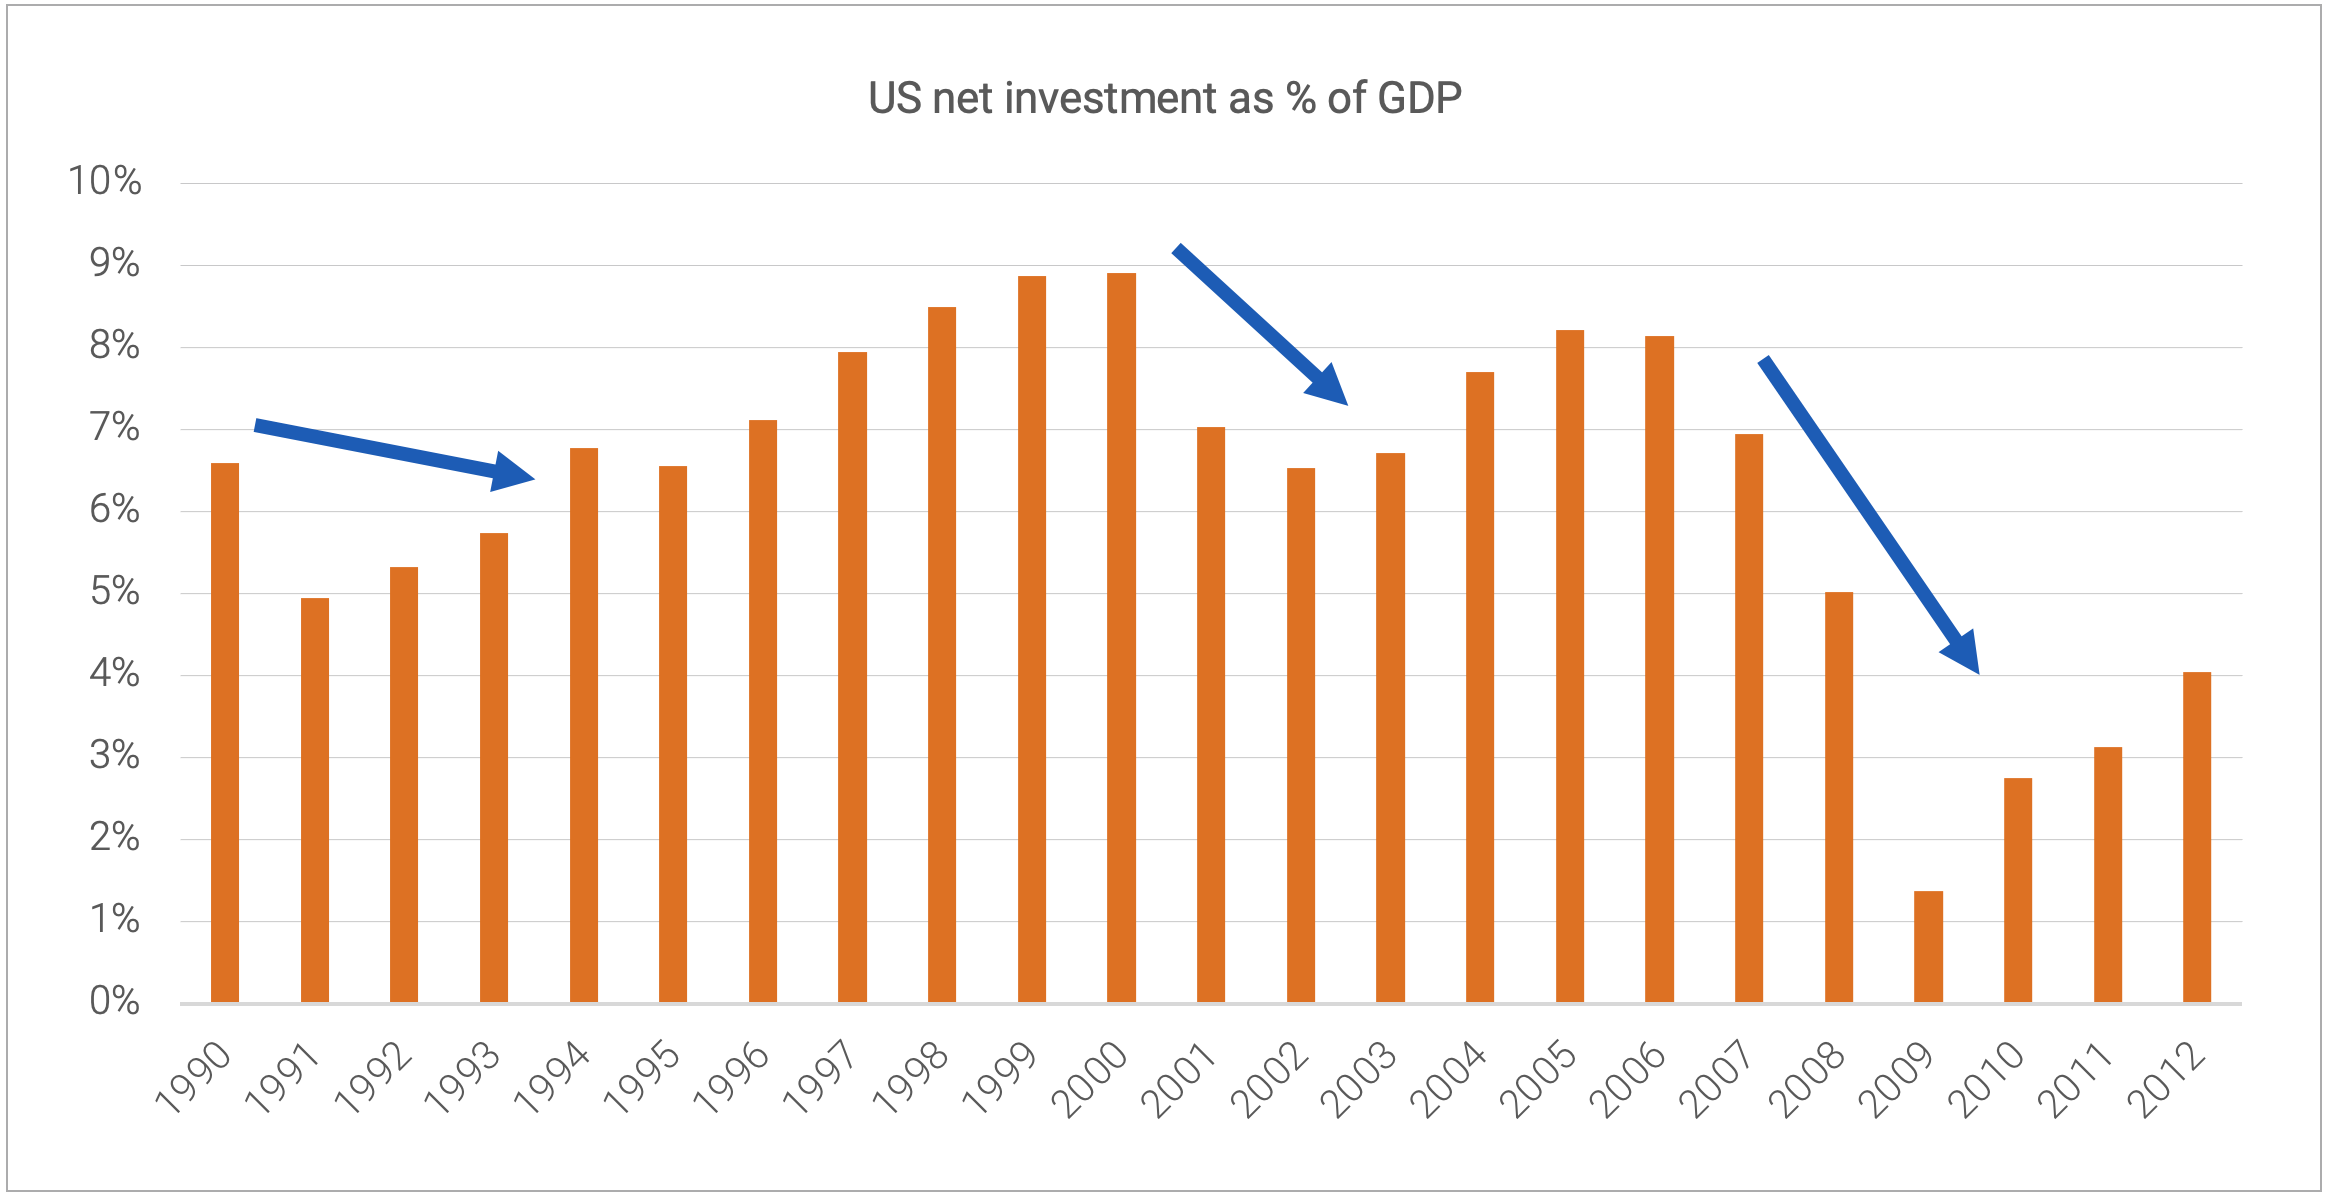 Source: BEA, Fred, Quay Global.
 Source: BEA, Fred, Quay Global.
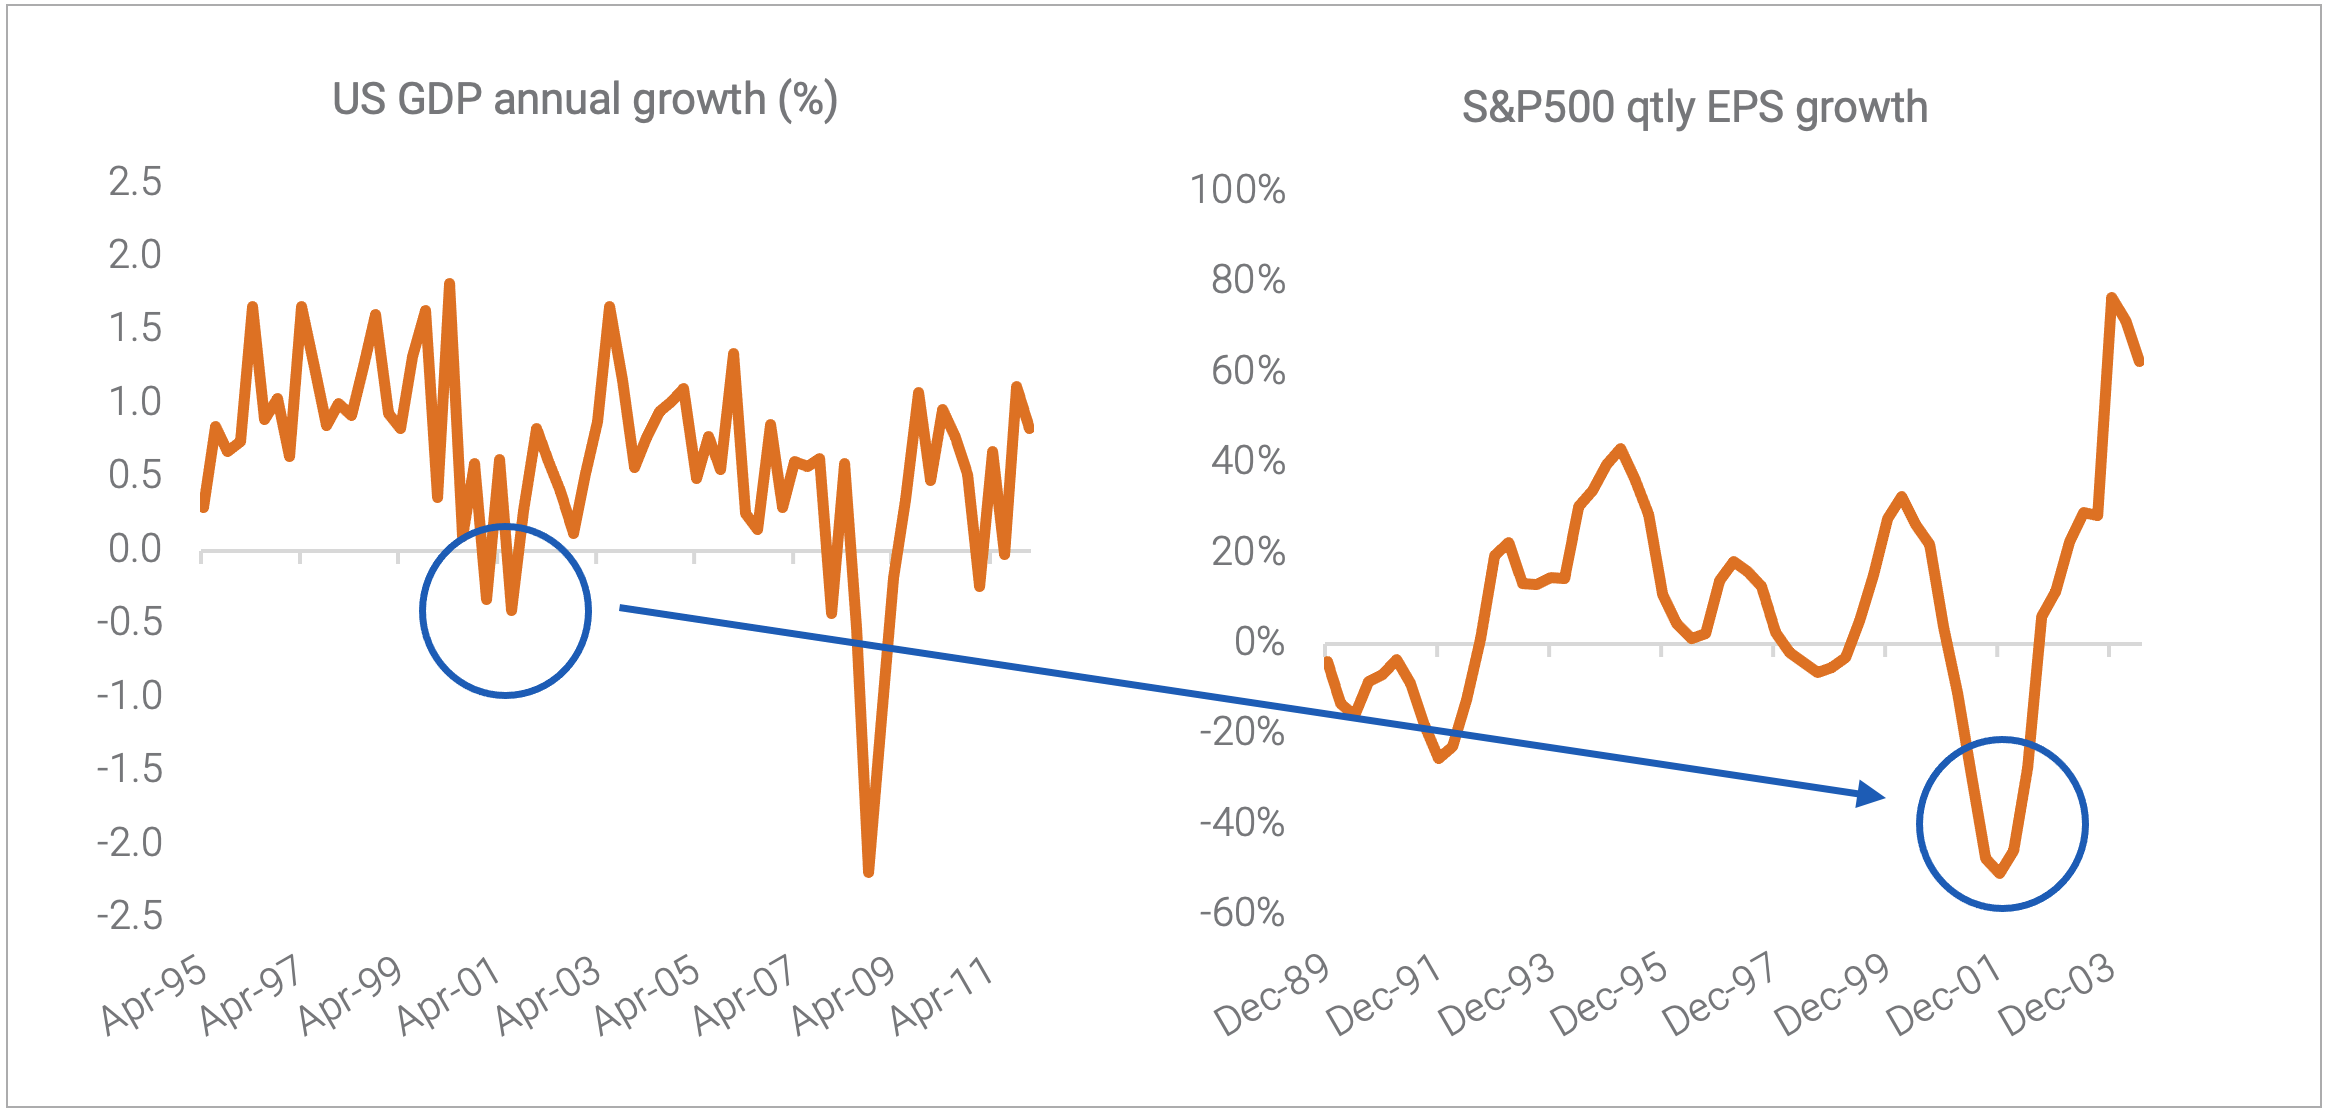
In 2001, the end of the prior tech capex cycle proved to be as vicious on S&P500 earnings as the deepest recessions. As a reminder, the 2000–2001 recession was relatively mild (-0.4% fall), yet resulted in a +50% decline in S&P500 EPS. Worryingly, technology-based shares today are a significantly larger share of market capitalisation compared to the late 1990s.
 Source: BEA, Schiller, Quay Global.
Fiscal support
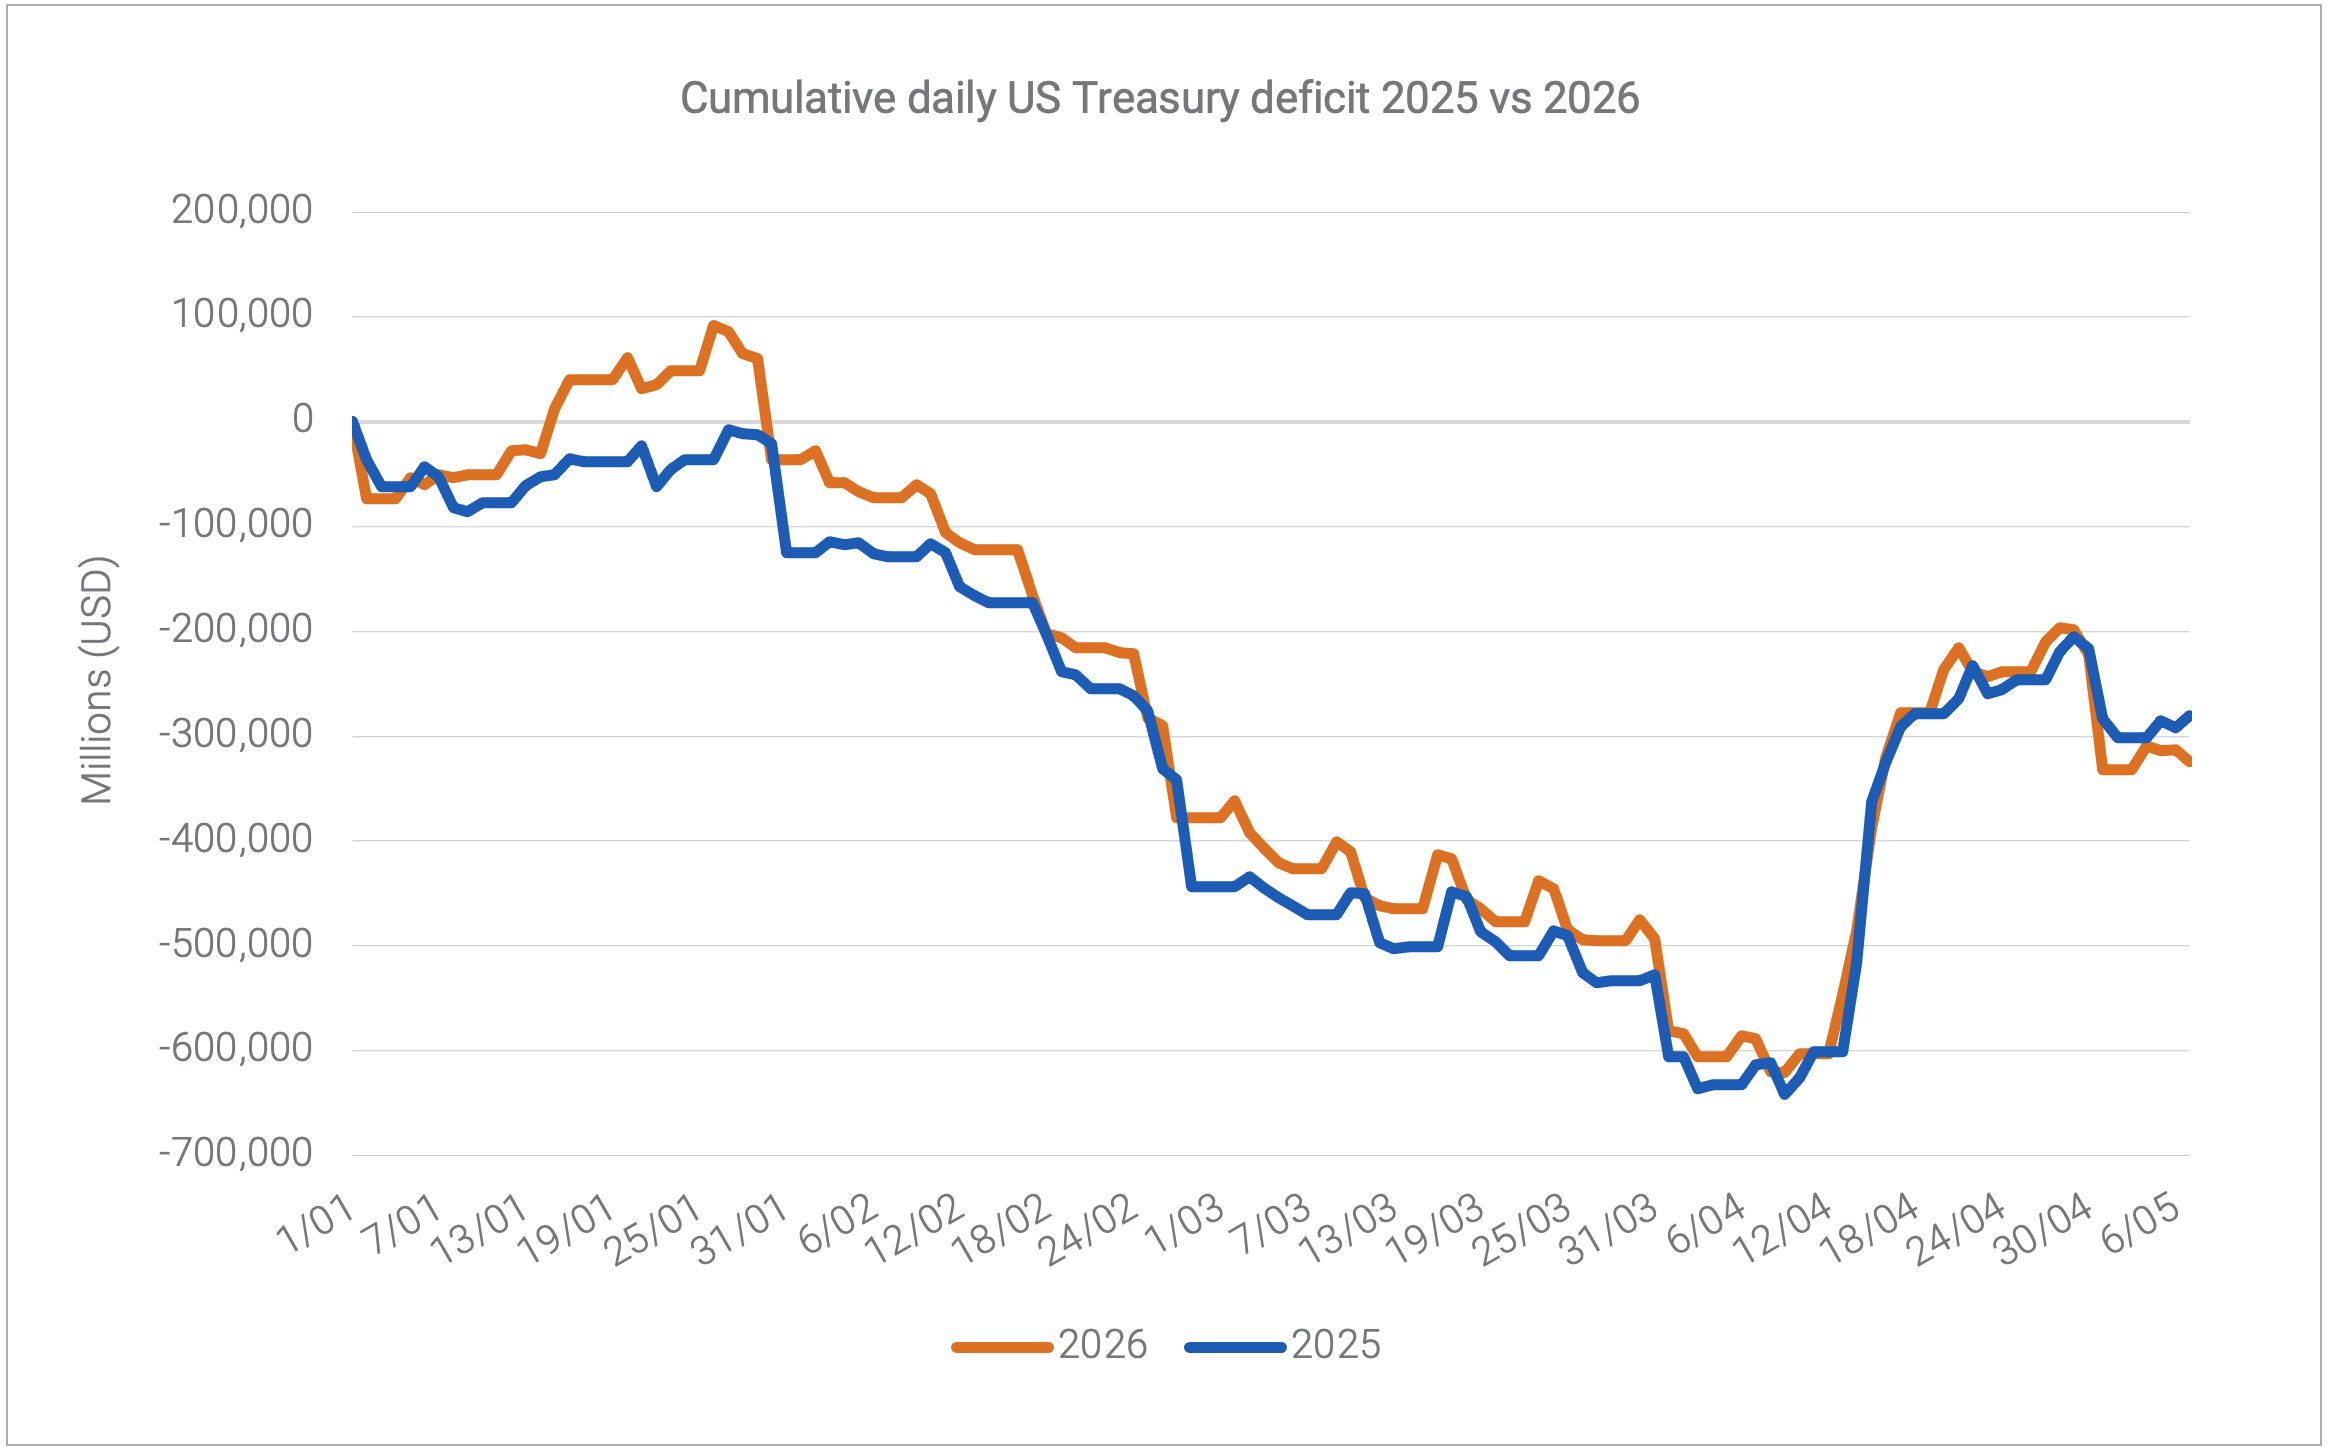
Unlike previous cycles, the US government continues to run a sustained fiscal deficit usually reserved for periods of economic downturn (roughly 5% of GDP). The deficit continues to add to company profits (and other non-government savings), pouring fuel on the capex earnings fire. If there is a downturn in investment and profits, will a divided US congress have the stomach for larger offsetting government deficits? Given that COVID spending was largely blamed for the pandemic inflation surge, one is not too sure.
 Source: US Daily Treasury Statement, Quay Global.
Outlook
The Kalecki profits equation is a powerful tool as it can help investors identify key macroeconomic drivers of past profits. Its shortcoming is that it is not a precise forecasting tool as there are too many moving parts to accurately predict.
However, the framework can be useful in identifying the risks. And the risks right now are:
- a massive AI capex boom which is driving profits; and
- an assumption by investors these investments will at least earn an economic return and hence avoid impairment (generating negative investment) and will continue to grow.
We have seen capex cycles before. As Mr Chanos, and Mr Kalecki will attest, these cycles drive earnings so that even with booming share markets, market-wide PE ratios can still look reasonable.
In determining whether this equity cycle is sustainable or not all comes down to whether the AI industry can sustain / generate an appropriate return on the massive levels of invested capital. And on this basis, recently there are a few warning signs, including:
- Uber capping employee AI spending after burning through its entire 2026 budget in four months.2
- Meta warning employees that internal AI usage costs are now approaching US$1bn and that token usage alone is not a measure of impact / progress of any kind.3
- The US government ban on certain AI tools for foreign use thereby limiting revenue growth.4
- OpenAI considering dramatic price cuts for tokens, sparking fear of a price war with rivals.5
In the face of these recent headlines, for the capex cycle to be sustained AI needs to be profitable for both AI companies and users. The question is, where do such outsized profits come from in an economy that only grows 2–3% per annum?
Now we are no experts in AI – and maybe the capex boom will meet minimum return requirements and hence be sustained. For example, the price cuts touted by OpenAI may generate more demand (Jevons paradox).
But that is the bet.
That is what everyone is now assuming.
And if it does not pan out that way, we believe a meaningful correction is assured.
It really is that simple.
The content contained in this article represents the opinions of the authors. The authors may hold either long or short positions in securities of various companies discussed in the article. The commentary in this article in no way constitutes a solicitation of business or investment advice. It is intended solely as an avenue for the authors to express their personal views on investing and for the entertainment of the reader.
[1] National savings is equal to national net investment.
[2] https://smarterx.ai/smarterxblog/ai-token-budgets-uber-microsoft
[3] https://mlq.ai/news/meta-caps-internal-ai-token-spending-after-costs-approach-billions-in-2026/
[4] https://www.afr.com/world/north-america/anthropic-shuts-down-latest-ai-models-after-sweeping-us-order-20260614-p606ko
[5] https://www.wsj.com/tech/ai/openai-considers-drastic-price-cuts-anticipating-war-for-users-with-anthropic-9b8c178e